Full Stack Electronics · Stage One · Experiment 1
Build a blinking LED circuit, then measure its timing and capacitor voltage.
Start with an NE555 timer chip and a blinking LED. You'll wire the circuit and check that it runs. Then you'll use the oscilloscope to see how the capacitor voltage controls each blink. I'll guide you through the wiring, the instrument settings and the first measurements.
This build gives you a reference for the timers you'll build later. Your readings can differ a little from mine. Record the behaviour and your measurements. Keep the board assembled so you can compare it with the next build.
It turns a resistor and a capacitor into a time interval. When a resistor feeds current into a capacitor, the capacitor charges at a rate that the two parts set together. The 555 watches that charging. It decides when the voltage is high enough or low enough, and it acts on that decision. Depending on the wiring, it repeats this continuously or does it once.
The blocks you build later each do one part of that job. Two comparators compare the capacitor voltage with two fixed levels. A latch (a one-bit memory circuit) remembers which comparator fired last. A transistor drains the capacitor, and an output stage drives the load.
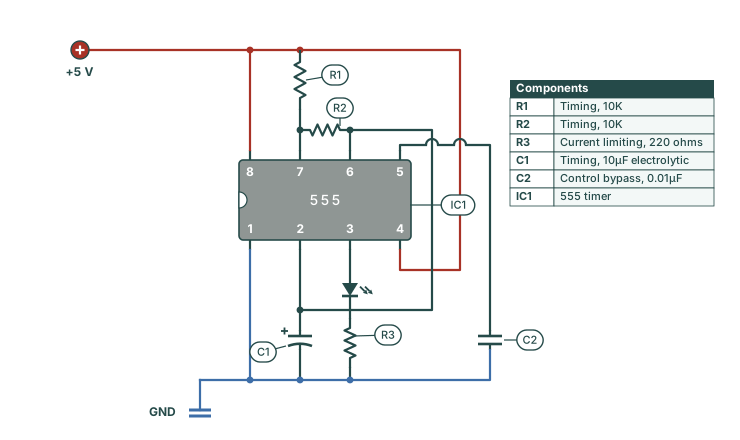
The circuit in Figure 1-1 charges and discharges capacitor C1 repeatedly. C1 charges through both timing resistors, R1 and R2, and discharges through R2 only. The LED is on during charging and off during discharging. We'll look at those two parts of the cycle on the oscilloscope.
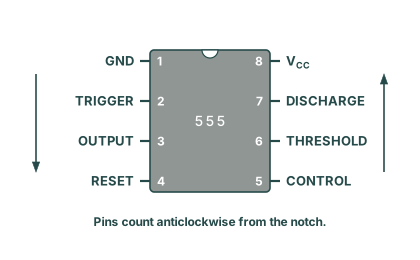
View the chip from above with its notch at the top. Pin 1 is then at the top left. Count down the left side and then up the right side, as Figure 1-2 shows. The circuit drawings turn the chip so that its notch faces left. The pin numbers stay the same, so use them to check each connection.
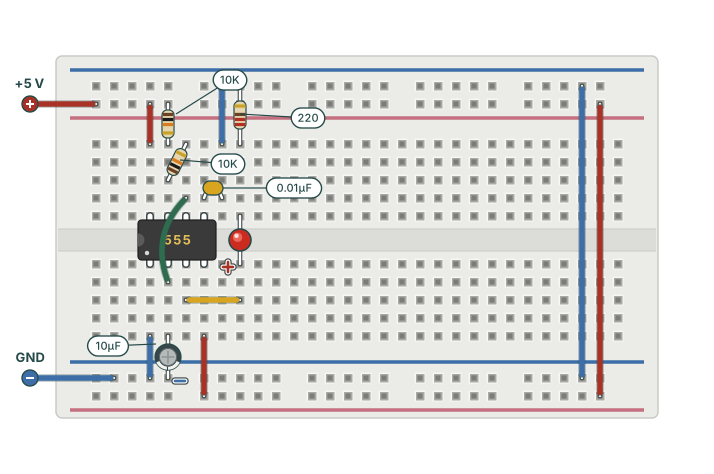
Check the capacitor polarity before you apply power. The stripe on the 10 µF electrolytic marks its negative lead. Connect that lead to ground. A reversed capacitor can be damaged, and it can become hot or vent. Turn the supply output off before you move any component or wire.
A wiring mistake is a normal part of building. Turn the supply output off before you change anything. Then work through these checks:
If the LED stays dark after those checks, use the oscilloscope steps below. A repeating waveform at pin 3 shows that the timer runs and that the LED circuit needs attention. If you get stuck, you can ask me at @dnixty. Send a photo of the wiring and your observations.
With the LED blinking about five times a second, the oscilloscope can show what drives it: the capacitor voltage and the output at pin 3. A channel is one measurement input of the oscilloscope. Each probe measures the voltage at its tip relative to its ground clip.
During charging, the capacitor voltage rises and the LED is on. During discharging, the voltage falls and the LED is off. Charging runs through two resistors and discharging runs through one. So the rise takes longer than the fall: about 0.14 s against 0.07 s with these parts. Both parts of the trace curve, because the current into the capacitor falls as its voltage nears the level it moves towards.
Use two oscilloscope probes. Each probe has a BNC connector for the oscilloscope, a tip or spring hook for the signal, and a short ground lead with a clip. A measurement needs both the tip and the ground connection.
Turn the bench supply output off before you connect the probes. Fit the BNC connector of one probe to the CH1 input of the oscilloscope. Fit the other probe to the CH2 input. Push each connector on and turn its collar to lock it. Use the numbered channel inputs on the front panel. Leave any external-trigger input empty.
| Oscilloscope channel | Tip or hook | Ground clip |
|---|---|---|
| Channel 1: output | Pin 3 of the NE555 | Ground rail |
| Channel 2: capacitor voltage | Positive lead of C1, joined to pins 2 and 6 | The same ground rail |
Connect both ground clips to the ground rail. That rail connects to the negative terminal of the supply, to pin 1 and to the negative lead of C1. Push a short bare jumper into that rail, so each clip has a secure point to grip.
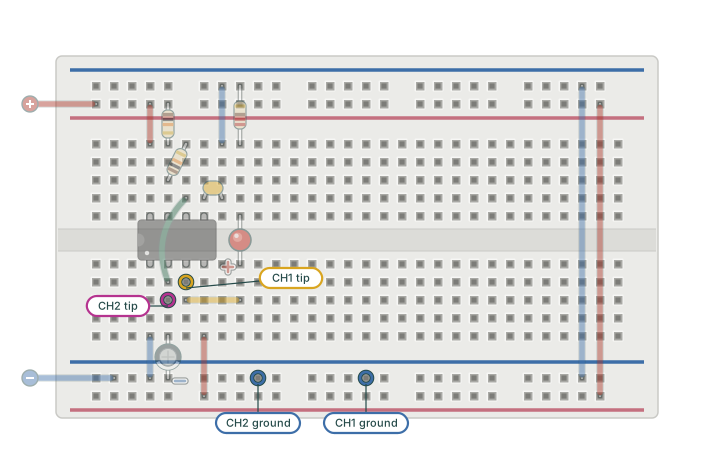
Inside this bench oscilloscope, the probe ground clips connect to each other and to protective earth. Connect both clips to circuit ground. A ground clip on the positive rail or on a signal node can short that point to ground. Keep the protective-earth connection of the oscilloscope intact.
If the display looks wrong, check the probe connections, the channel settings and the trigger before you change the circuit. Make sure that both channels are on and set to DC coupling.
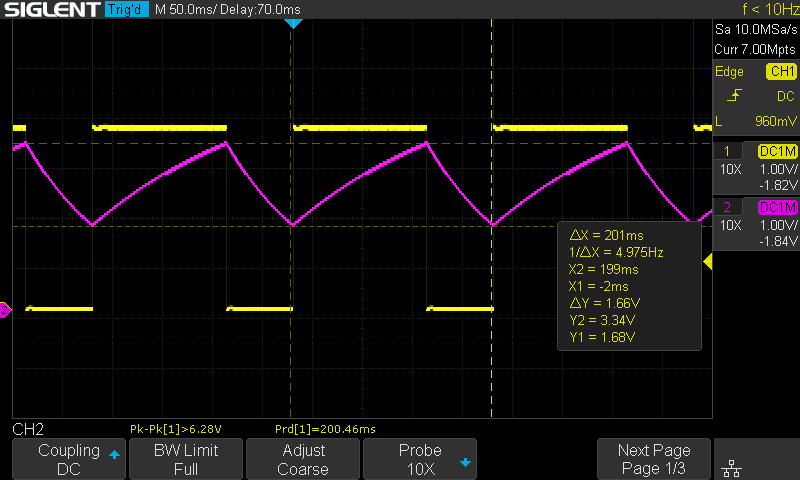
On the SDS1104X-E, press Cursors and select Manual mode. Make sure that the cursor source is CH2, the capacitor trace. The cursor source is separate from the trigger source.
| Measurement | Expected with nominal parts | My recorded result |
|---|---|---|
| Period | About 208 ms | 200.46 ms |
| Frequency | About 4.81 Hz | 4.99 Hz |
| Output duty cycle | 66.7% | 66.76% |
| Capacitor minimum at 5.00 V supply | About 1.67 V | 1.68 V |
| Capacitor maximum at 5.00 V supply | About 3.33 V | 3.34 V |
Use your readings as the baseline for your later builds. Component tolerances and measurement uncertainty change the last digits. If the voltages are far from the expected fractions, first check the probe settings (10×) and the cursor source. If you have a multimeter, use it to check a suspicious steady voltage.
My capture shows the capacitor voltage moving between 1.68 V and 3.34 V, with a period of 200.46 ms. Two voltage thresholds set when the capacitor changes direction. The resistors and the capacitor set how long each part of the cycle takes.
Hans Camenzind designed the 555 in 1971. He was a Swiss-born engineer who worked under contract to Signetics. Signetics put the chip on sale in 1972. Inside the chip, a chain of three equal 5 kΩ resistors connects across the supply. That chain sets the one-third and two-thirds levels that you measured.
The name is often said to record those three resistors: 5, 5, 5. Camenzind described the name as a marketing choice, unconnected to the resistor values. You build a chain of three equal resistors in Experiment 2, and again on the transistor board in Experiment 9, which tells the story of the name.
The capture shows two turning points, at 1.68 V and 3.34 V. Inside the chip, two comparators watch for those levels. A comparator compares two voltages and switches its output to show which voltage is higher. In your circuit, one cycle runs like this:
You'll build these blocks in later experiments.
The same eight pins can do three different jobs, depending on how they are wired. Wired as in Figure 1-1, as an astable, the timer runs freely and switches back and forth continuously. That makes the LED blink. With different wiring it becomes a monostable: a one-shot circuit that gives a single timed pulse when triggered, then waits. Wired with no timing capacitor, with pin 2 setting the output high and pin 4 resetting it low, it becomes a bistable. A bistable is a set-reset latch, which can de-bounce a switch.
This course uses the astable mode throughout. A blinking LED is a useful first check. The timing and voltage measurements show more about whether the circuit behaves as expected.
The steps above show when the chip switches. The resistors and C1 set how long each part of the cycle takes. C1 charges through R1 + R2 and discharges through R2. The maths of an exponential curve that crosses fixed fractions of the supply voltage gives this blink frequency:
With R1 = R2 = 10 kΩ, C = 10 µF and ln 2 ≈ 0.693, the formula predicts 4.81 Hz. My build measured 4.99 Hz, about 4% higher. Resistor and capacitor tolerances, the non-ideal behaviour of the chip and measurement uncertainty can all contribute to that difference. The frequency measurement alone does not give the actual value of the capacitor.
Charging runs through both resistors, and discharging runs through R2 alone. So the high part of each cycle takes longer than the low part. With these parts, the formulas below give 0.139 s high against 0.069 s low. My capture works out to about 0.134 s high and 0.067 s low (66.76% of 200.46 ms).
The fraction of each cycle spent high is the duty cycle. It equals , which is exactly two-thirds with equal resistors. My measured duty cycle is 66.8%. This circuit cannot go below 50% without a steering diode. The charging current always flows through R2, and through R1 as well. If you want to see where the two times come from, open the derivation below.
Let be the voltage on the timing capacitor, its capacitance, the supply voltage, and the current that flows into the capacitor. During the high part of the cycle, the capacitor charges from the supply through and in series. Write for that series resistance.
Two relations set the charging rate. The first is Ohm's law across the series resistance. One end of it is at and the other end is at :
The second is the defining relation of a capacitor, , differentiated with respect to time. Current is the rate at which charge arrives, so:
The same current appears in both equations, so set them equal:
Divide both sides by . The rate of change is then on its own:
The quantity appears again and again. It is the voltage that the capacitor still has to climb. Call it the gap, :
Differentiate that definition. The supply voltage is constant, so its derivative is zero. The gap therefore shrinks exactly as fast as the voltage climbs:
Substitute both results into the rate equation. The left side becomes the negative of the rate of change of the gap. The numerator on the right is by definition:
Multiply both sides by :
In words: the gap closes at a rate proportional to its own size, with time constant .
Separate the variables. Divide both sides by and multiply both sides by . Each variable is then on its own side:
Integrate both sides from the start of the charge, when and the gap is , to a general time :
The integral of is , and the integral of is :
The difference of two logarithms is the logarithm of the ratio. So the left side becomes one term:
To free from the logarithm, raise to the power of each side. The exponential cancels the logarithm, because . The right side becomes an exponent:
Multiply both sides by :
So during an RC charge, the gap to the target decays exponentially. The target only sets where the gap is measured from.
How long does the gap take to fall from to a fraction of itself? Set . Then cancels:
Take the natural logarithm of both sides:
Multiply both sides by :
The time depends only on and on the ratio by which the gap shrinks. The absolute size of the gap, and therefore the supply voltage, is no longer in the equation.
Apply this result to the high part of the cycle. The capacitor climbs from one-third of the supply voltage to two-thirds. So its gap to the supply falls from two-thirds of the supply voltage to one-third:
The supply voltage cancels in that ratio. With in place of :
During the low part, pin 7 holds the junction of R1 and R2 at ground. The capacitor then discharges through alone, towards 0 V. Ohm's law across gives the current into the capacitor:
Set it equal to the capacitor current, as before:
The gap to the new target, 0 V, is the capacitor voltage itself, so . Divide both sides by :
This is the same equation as before, with time constant . The gap falls from two-thirds of the supply voltage to one-third, so again :
A different pair of threshold fractions would give a different logarithmic factor.
One period is one high interval plus one low interval:
The frequency is the reciprocal of the period:
The duty cycle is the high interval divided by the period. The factor cancels:
The 1.44 in the datasheet formula is one divided by ln 2. With 10 kΩ for each resistor and 10 µF, the high interval is 0.693 × 20 kΩ × 10 µF = 0.139 s. The low interval is 0.693 × 10 kΩ × 10 µF = 0.069 s. The period is 0.208 s, and the frequency is 4.81 Hz, the prediction quoted above. The duty cycle is 20 kΩ / 30 kΩ = 2/3.
This derivation assumes exact threshold fractions. It also assumes a discharge transistor that pulls pin 7 all the way to ground. Physical components depart from those assumptions. Use the formula as a prediction to compare with the bench. Expect some difference between the prediction and your readings.
The frequency formula contains R1, R2 and C, and no supply voltage. The two switching thresholds and the charging target all scale with the supply voltage. In the ideal circuit those changes cancel, so R1, R2 and C alone set the timing. This behaviour is called ratiometric. An NE555's measured frequency can still change slightly, because the cancellation is approximate.
The timing formula contains no supply voltage, and you can test that on the bench. When the supply drops from 5.00 to 4.50 V, one-third of the supply becomes 1.50 V and two-thirds becomes 3.00 V. The charging target drops by the same fraction, so the formula still gives 4.81 Hz. The measured frequency should stay approximately the same.
Record your baseline readings. Set power supply output 1 to 4.50 V. Repeat the capacitor-limit and period measurements. Then set output 1 back to 5.00 V. The specified supply range of the NE555 starts at 4.5 V, so go no lower. Experiment 9 examines this behaviour on the divider of your transistor board.
1. Across one full cycle, the voltage on the timing capacitor moves between…
The trigger comparator reverses the cycle at a third of the supply voltage. The threshold comparator reverses it at two-thirds. On a 5.00 V supply, those levels are about 1.67 V and 3.33 V. Once the timer runs, the capacitor never returns to ground or reaches the full supply voltage.
2. Lower the supply to 4.5 V and the blink rate barely changes. The reason is that…
Each level that the capacitor moves towards or switches at is a fixed fraction of the supply voltage. When the supply changes, all of these levels change together. So the supply voltage cancels from the ideal timing equation. A built circuit can show a small change. Experiment 9 measures how closely the references on the transistor board follow the supply.
3. The LED stays on about twice as long as it stays off because…
Charging runs through R1 and R2 together. Discharging runs through R2 alone. So the high part of the cycle is the longer part. With equal resistors, the duty cycle is two-thirds. It cannot go below one half without a steering diode.
If the inner workings of the 555 still seem unclear, that is fine. I was still confused at this stage too. The chip only started to make sense to me when I built it from scratch, one block at a time. You can continue without a full picture of the inside of the chip. The next experiments build those blocks one at a time.
You built and measured the reference timer. In Experiment 2, you'll build the same behaviour from separate comparator and logic chips. The connections between the functional blocks are then open to your probes.
Reference documentation: TI NE555 datasheet and Siglent SDS1000X-E user manual.