Full Stack Electronics · Stage Three · Experiment 4
Give the comparator a second input, and choose its threshold yourself.
In Experiment 3 you built a comparator from one transistor. Its output fell from high to low as the input rose from 0.60 V to 1.10 V. A heat gun moved that fall down by 0.26 V. The NE555 compares against 1.67 V and 3.33 V, and those levels must hold as the chip warms. One transistor compares against its own base-emitter voltage, which nothing outside the circuit sets and which falls as the silicon warms. This experiment adds a second transistor: its base becomes the reference input, and the two junctions warm together.
The aim is that much of the drift cancels. Figure 4-7 tests this: under the same heat gun, my pair showed no clear threshold movement at that scale. The wide transition remains, and Experiment 6 fixes it.
The circuit is called a differential pair: two transistors with their emitters joined, which share one current through a single resistor to ground. Each base is an input: one takes the signal, as before, and the other takes a reference voltage from power supply output 2. The output changes state as the signal passes through a region near the reference. That is the function of a comparator, and both comparators inside the 555 start from this circuit. Experiments 5 and 6 improve this pair. Experiment 8 builds the same pair from PNP transistors for the second comparator of the 555.
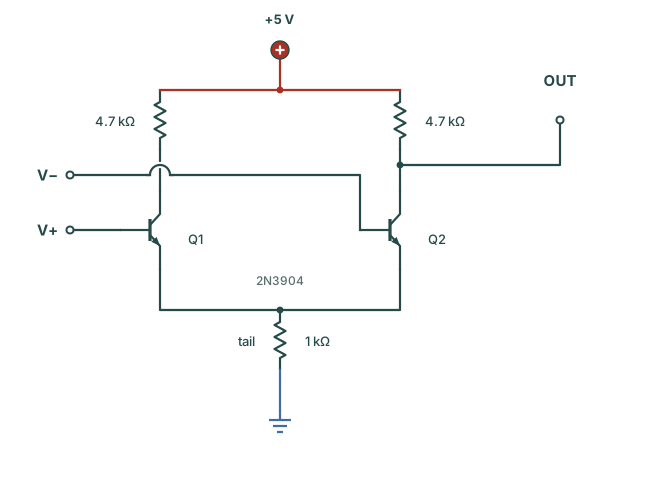
Figure 4-1 shows the circuit described above. Q1 is the transistor from Experiment 3, without its base resistor. Q2 is its twin. Their emitters meet at one point, and a 1 kΩ resistor connects that point to ground. This resistor is the tail, and the current through it is the tail current. Each collector has its own 4.7 kΩ resistor to +5 V.
The base of Q1 is the input that the function generator sweeps, labelled V+. The base of Q2 is the reference input, V−. The output is the collector of Q2.
Figure 4-2 shows the pair on the board of Experiment 3. The transistor of Experiment 3 stays at 9h, 10h and 11h and becomes Q1. The rail links at columns 28 and 29 and the power supply leads also stay. Three parts of Experiment 3 must go first.
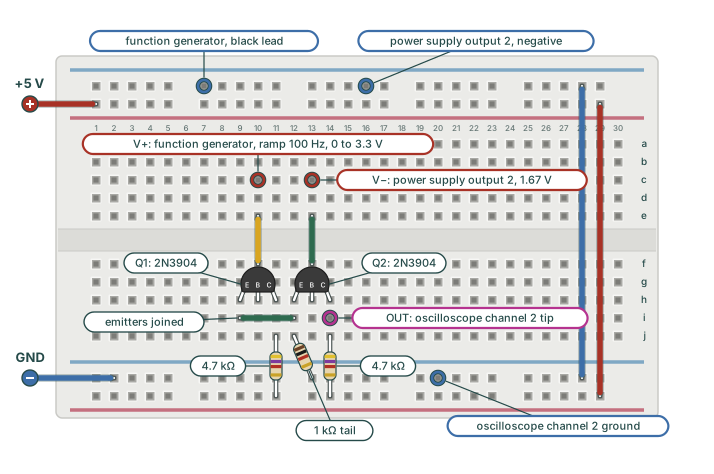
With the pair on the board, it needs its two inputs: the swept signal on V+ and the fixed reference on V−. The signal leads are the same as in Experiment 3, as Figure 3-2 shows. The function generator feeds a T-piece on oscilloscope channel 1, and the mini-hook lead goes from the T-piece to the board. Oscilloscope channel 1 shows the input that the circuit receives, and oscilloscope channel 2 shows the output. The new part is the reference. It comes from power supply output 2, as in the LM393 tests of Experiment 2.
The output load of the function generator must be HiZ, as in Experiment 3. On the SDG1062X, hold the Output key of the channel for two seconds, or use Utility → Output Setup → Load → HiZ. If the triangle on oscilloscope channel 1 reaches 6.6 V instead of 3.3 V, this setting is the cause. Check it at the start of each session.
With the reference set and the triangle sweeping through it, the first question is where the output changes state. In Experiment 3, the transistor and its base resistor set the switching region. Here the second input is at 1.67 V, so the transition should be near that voltage.
This section measures two things. The threshold is the input voltage where the rising output crosses halfway between its low and high levels. The transition width is the range of input voltage over which the output rises from nearly low to nearly high. Use the same output levels for each reference value, and record the reference voltage with them.
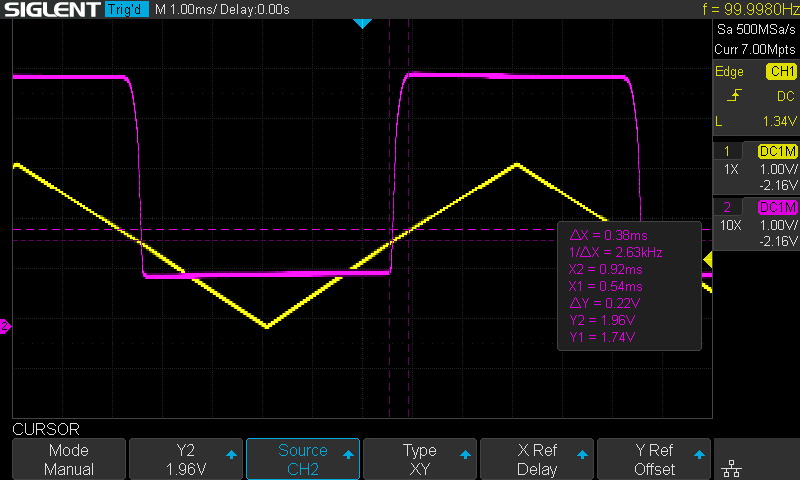
The magenta output is low during the lower part of the yellow triangle. It rises as the input passes through the switching region, and it falls again as the input falls. This direction is the reverse of Experiment 3: more input now gives more output.
First, measure the threshold. Press Cursors, and set the type to XY and the source to oscilloscope channel 1. Put an X cursor where the output crosses halfway, and a Y cursor on the input trace at that instant. Record the input voltage. In Figure 4-3, the halfway crossing lies inside the bracket below, between 1.74 V and 1.96 V.
Then bracket the transition. Put X1 where the output starts to rise, and X2 where it reaches the top. Move Y1 and Y2 onto the input trace at those two instants. In Figure 4-3 the input readings are 1.74 V and 1.96 V, so the width is 0.22 V. This interval is about 0.1 V above the 1.67 V reference. The X-Y capture in Figure 4-5 starts its rise nearer the reference, and the next section calculates where the rise should start.
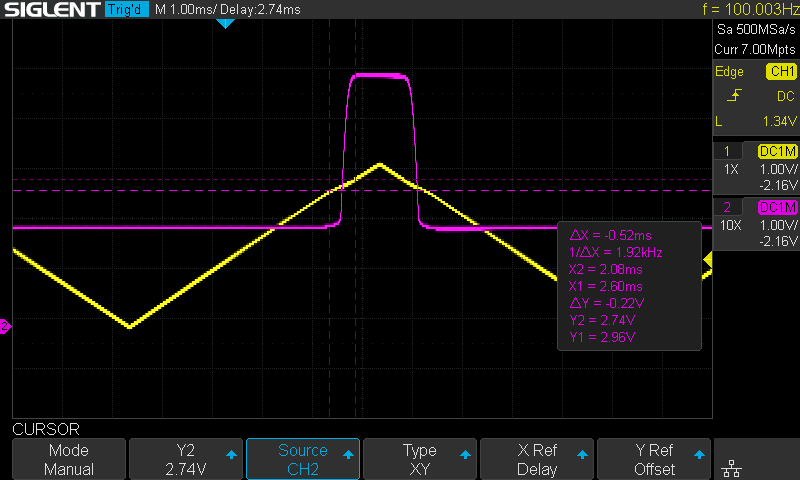
Increase power supply output 2 to 2.67 V, and repeat both measurements. In Figure 4-4 the rise starts near 2.8 V, about a volt above the rise in Figure 4-3. The input now spends less time above the switching region, so the high part of the output becomes a narrow pulse. These readings show that the transition follows a change in the reference. The NE555 needs this ability to choose a comparison level for its two thresholds.
Two more features are visible. With the reference at 1.67 V, the low output level is near 1 V, and the next section explains why. The edge also still slopes. Its measured width, 0.22 V, is less than half the 0.5 V of the single transistor. A sharper transition is still necessary, and Experiment 6 provides it.
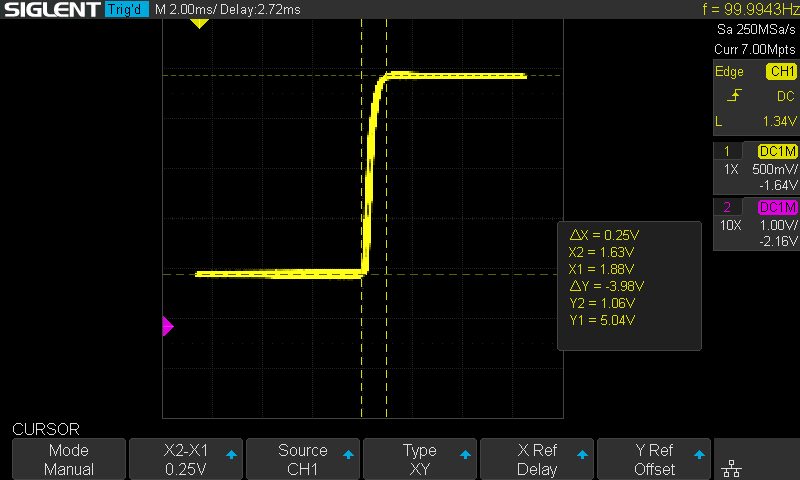
X-Y mode shows the same transition as a transfer curve, output against input. Press Acquire and set the XY softkey to On. Set oscilloscope channel 1 to 500 mV/div. Figure 4-5 shows my capture. The two shelves are the low and high output levels, about 1 V and 5 V.
The cursors in Figure 4-5 bracket 1.63–1.88 V of input and 3.98 V of output. That is a similar width, 0.25 V, but the interval starts 0.11 V lower than in Figure 4-3. To compare the two views on your board, keep the reference and the function generator settings the same. Use the same output levels for the endpoints.
The measurements leave three questions: why the transition follows the reference, why the low level is near 1 V, and where the rise starts. The answers come from how the pair shares the tail current. With V− at 1.67 V and Q2 conducting, the joined emitters are about one base-emitter drop below V−, near 1 V. So the 1 kΩ tail carries about 1 mA. Near the crossover, we can treat this current as approximately constant. Then we can study how the pair divides it.
Both emitters are at the same voltage. So the transistor with the higher base has the larger base-emitter voltage. Its collector current increases steeply with that voltage. So a small difference between the inputs can move most of the current to one side.
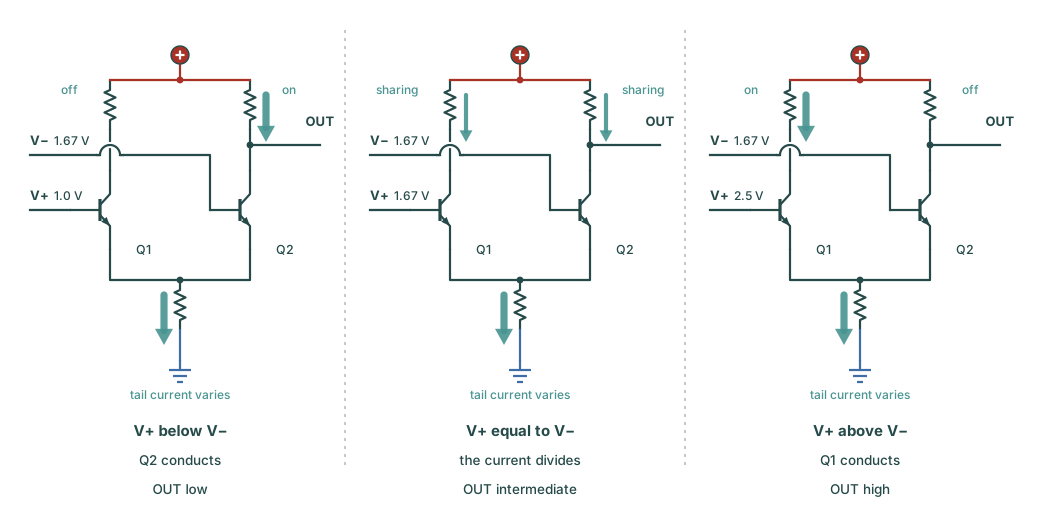
Figure 4-6 shows the three cases. With V+ well below V−, Q2 conducts and pulls the output low. With V+ well above V−, Q1 conducts, Q2 carries almost no current, and the output rises to +5 V. Matched transistors share the current equally when their bases are equal, if neither transistor is saturated. So the handover occurs near the reference, and a change of reference moves it.
The resistor tail makes the total current depend on the emitter voltage. When V+ rises well above V−, the emitters follow the base of Q1 upwards, and the tail current increases. The arrows in the figure show which side conducts. Their sizes are only a guide to the division of current in each case. A later section measures the changing total.
Now the low level. If Q2 took the whole 1 mA through its collector, its 4.7 kΩ resistor would drop 4.7 V. The collector would then be at 0.3 V, below the emitter near 1 V. That calculation then no longer describes the transistor: Q2 saturates. Its collector stays a small saturation voltage above its emitter, which puts the output a little above 1 V.
In saturation, a large current can also flow in through the base. So the collector current alone no longer accounts for the tail current.
At the other extreme, Q2 is off. Its load resistor carries almost no current, and the output rises to +5 V.
Saturation also sets where the rise can start. The output cannot leave its low shelf until the collector of Q2 rises clear of its emitter, near 1.1 V. That needs a current in Q2 below (5 V − 1.1 V) ÷ 4.7 kΩ, about 0.83 mA of the 1 mA tail. That split occurs about 40 mV before V+ reaches V−, near 1.63 V. The X-Y capture in Figure 4-5 starts its rise at 1.63 V. The time-display readings in Figures 4-3 and 4-4 are 0.1 V to 0.2 V higher, and these captures do not show the reason.
What happened to the base-emitter voltage that set the threshold in Experiment 3? Each transistor still needs a base-emitter voltage to conduct. At equal collector currents, matched transistors need almost the same voltage. Their shared emitter connection then makes their bases almost equal too. So the comparison is now between two inputs. Any mismatch between the junctions moves that balance.
The mechanism in Figure 4-6 is called current steering. The two transistors share an emitter connection and one resistor for their combined current. A difference between their base voltages changes how that current divides. Near the crossover, an approximately constant total makes the exchange easy to see: as one collector carries more, the other carries less. A resistor tail is approximately constant only over a small input range. In Experiment 5 a current source makes that approximation much better.
Current steering leaves a question of scale: how large a difference between the bases moves most of the current to one side? Take matched transistors that are not saturated, at room temperature. A 60 mV difference between the bases gives a collector current ratio of about ten to one. If we neglect base current, that is about 91 % of the tail against 9 %. A 120 mV difference gives about a hundred to one.
This steep relation explains how a small input change moves conduction from one side to the other. The load resistors and saturation also shape the output voltage. At the centre of the step, the slope of the output should be about 46. Across the cursor interval in Figure 4-5, 3.98 V of output divided by 0.25 V of input gives an average slope of about 16. The slope is steepest at the centre and becomes flatter towards both shelves. Experiment 6 increases the gain.
First, the ratio of the currents. The collector current of a transistor increases exponentially with its base-emitter voltage:
Here is about 26 mV at room temperature, and is a constant of the transistor. Matched transistors have the same . The emitters are joined, so the difference between the two base-emitter voltages equals the difference between the bases, . Divide the current of Q1 by the current of Q2. The constant cancels, and the two exponentials combine:
For a difference of 60 mV, 60 ÷ 26 = 2.31, and . The larger share is 10 ÷ (10 + 1) = 0.91, or 91 %. For 120 mV, 120 ÷ 26 = 4.62, and .
Second, the start of the rise. The output leaves its low shelf when Q2 carries 0.83 mA. Q1 then carries the rest of the 1.02 mA tail, 0.19 mA, and the ratio is 0.83 ÷ 0.19 = 4.4. Take the natural logarithm of both sides of the ratio equation, with Q2 as the larger current:
So the rise starts at about 1.67 V − 0.04 V = 1.63 V.
Third, the slope at the centre. The slope of the exponential is the transconductance : the change in collector current per volt of change in base-emitter voltage. Differentiate with respect to . The derivative of the exponential is the same exponential, multiplied by . The result is divided by :
At the centre, each transistor carries half of the 1.02 mA tail, 0.51 mA:
Let the bases differ by a small voltage . The current that Q1 gains is the current that Q2 loses, so the joined emitters stay almost still. The base-emitter voltage of Q1 rises by , and that of Q2 falls by . So the current in Q2 falls by . The output is 5 V minus the drop across the 4.7 kΩ load , so less current gives a higher output:
The gain is the output change divided by the input difference that caused it:
The pair on your board is an old arrangement, older than the transistor. Alan Blumlein, an engineer at EMI, filed a patent for it in 1936, with valves. His work also includes stereo recording and wartime radar. He wanted an amplifier that ignored slow changes common to both inputs, such as drift in its supply. In his drawings, the shared resistor went a long way down to a large negative supply. So the circuit is still called a long-tailed pair, and the shared resistor is called the tail.
The reference input fixes flaw 1 from the list of Experiment 3. Flaw 3 was drift: the heat gun moved the threshold of the single transistor down by 0.26 V. The base-emitter voltage needed for a given collector current falls as silicon warms, typically by about 2 mV per degree Celsius. In a matched pair, warming both transistors together changes both junction voltages by similar amounts. So the input difference needed to balance their currents should change much less.
Return power supply output 2 to 1.67 V. Press Acquire and set the XY softkey to Off. Set both channels to 1 V/div and the timebase to 1 ms/div. Trigger on oscilloscope channel 1, so that the input stays in one place on the screen. Press Display/Persist, set the Persist softkey to Infinite, and set the Color softkey to On.
For this test, the threshold is the input voltage where the rising output leaves its low shelf. This is the equivalent of the point used in Experiment 3. Record that input voltage at room temperature.
Warm both packages for a few seconds with a hair dryer, or with the heat gun on its lowest setting, from a hand's width away. Stop before the plastic of the transistors softens. Read the input voltage again where the warm trace leaves the low shelf. Repeat the reading as the pair cools. Subtract the warm reading from the cold reading to find how far the threshold moved down.
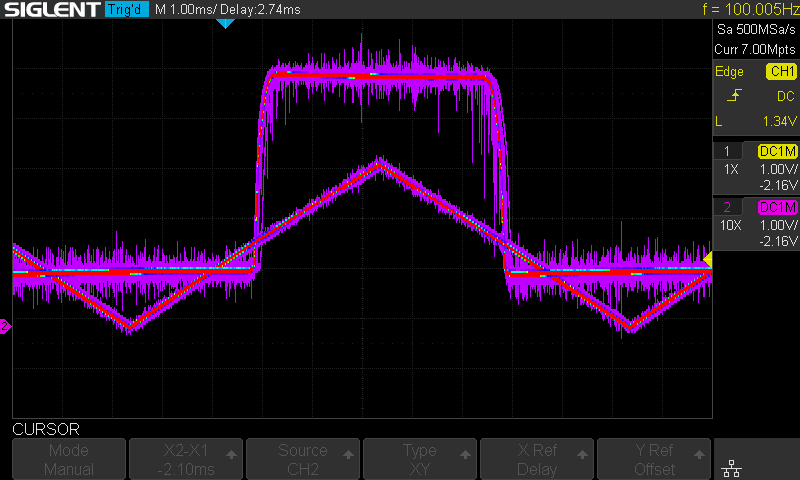
In Figure 4-7 there is no clear threshold movement at this scale. At this timebase, the 0.26 V shift of Experiment 3 would move the edge by about 0.4 ms, two fifths of a division. The persistence band includes noise, and it can also include small changes in the switching point. Its appearance alone cannot separate them.
Two 2N3904s from one bag are similar, and two separate packages in moving air are seldom at the same temperature. So the cancellation on a breadboard is probably incomplete. Inside an integrated circuit, the two transistors of a pair sit side by side on one piece of silicon, at one temperature. They also match far more closely than two separate parts. That is one reason the comparators of the 555 are built as pairs on a single die. On a breadboard, seating the two packages close together, as in step 2, keeps their temperatures closer.
The heating test changed something that both sides share. The same idea applies to the inputs. Two input voltages can also be described by two other numbers: their difference, V+ − V−, and their average. The difference is the signal that a comparator acts on. The average, called the common-mode level, says how high the two inputs sit together.
An ideal comparator responds to the difference and ignores the common-mode level completely. It gives the same result with both inputs near 1 V or near 3 V, as long as the same input is higher. The heating test checked how well the pair rejects a shared change in its junction voltages. The next test checks a different shared change: both input voltages moving together.
We can now choose a reference, and warming both transistors together gave no clear movement at the scale of Figure 4-7. But the pair has another limitation. Join its two bases and sweep them with the function generator: their voltage difference stays zero. If the pair rejected their shared movement completely, its output voltage would stay constant.
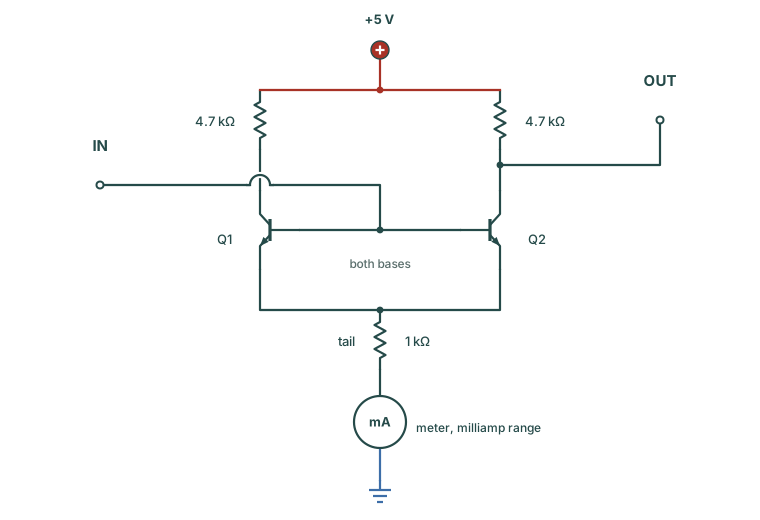
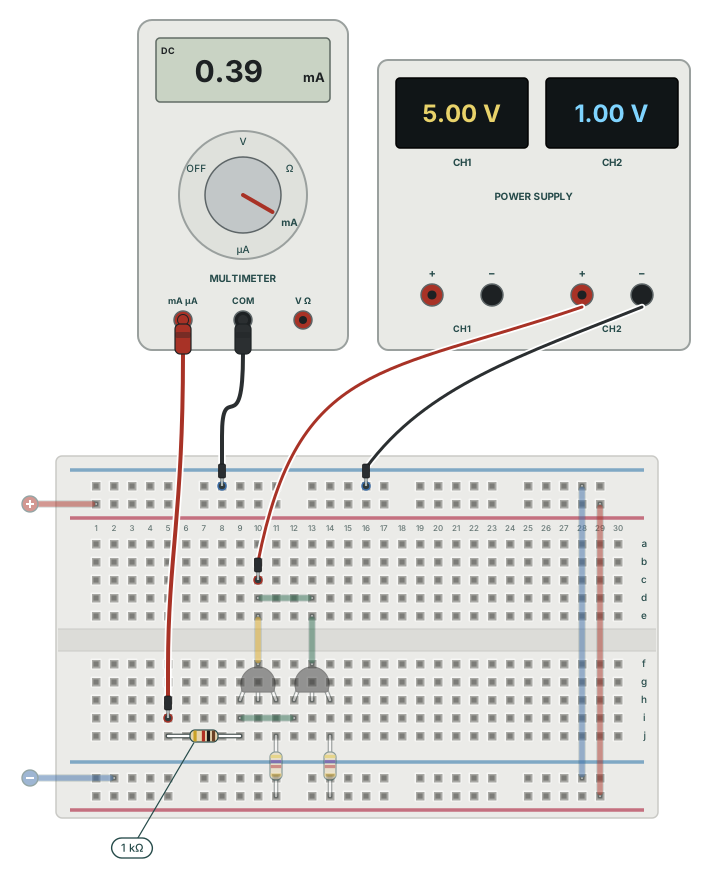
Figure 4-8 shows the circuit, with the meter that the second half of the test adds. Figure 4-9 shows the changes on the board for the first half.
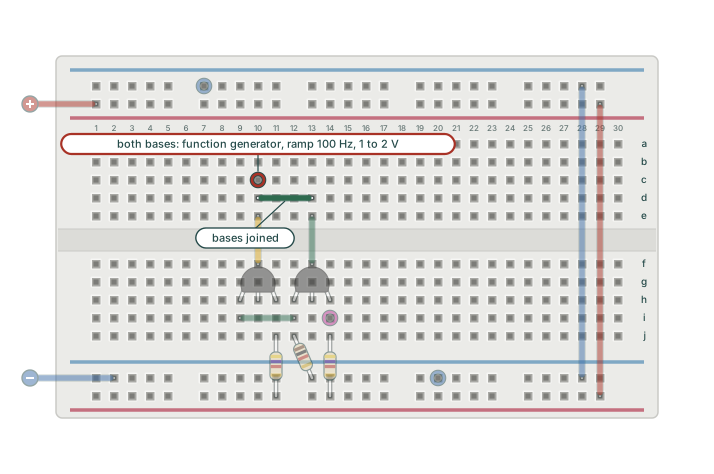
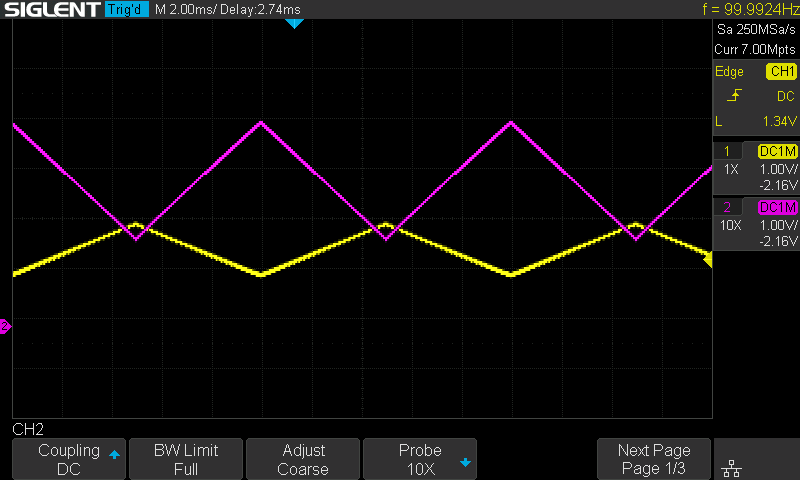
Now look at oscilloscope channel 2. The output is a triangle of its own. At 1 V/div it spans just under two and a half divisions, about 2.4 V from top to bottom, while the input spans one division. It also runs opposite to the input: as both bases rise from 1 V to 2 V, the output falls. The inputs carried no difference, but their shared movement still reached the output, more than twice its original size. This effect is called common-mode feedthrough, and the next section finds its source.
The bases carried no difference, so the triangle at the output must come from something that both sides share. Follow the voltages down the circuit, starting at the bases.
This test shows the limit of the approximately constant current used near the crossover. When the inputs move together, the emitter voltage rises and the tail current changes considerably. The two transistors still divide the current, but the total changes. Each collector resistor converts its share of that change into an output voltage change.
The chain above gives about 0.35 mA at a shared input of 1 V and 1.35 mA at 2 V. Measure those currents with the meter, as in Figure 4-11. A current meter must be part of the circuit that carries the current. So set the function generator output and both power supply outputs to OFF before you open the tail connection.
| Common-mode level | Tail current, measured | Calculated, (V − 0.65 V) ÷ 1 kΩ |
|---|---|---|
| 1.00 V | 0.39 mA | 0.35 mA |
| 2.00 V | 1.36 mA | 1.35 mA |
One volt of common-mode level increased the tail current from 0.39 mA to 1.36 mA, three and a half times. Both readings are within a few hundredths of a milliamp of the 0.35 mA and 1.35 mA calculated above. The oscilloscope and the meter also agree. Half of the extra milliamp flows in Q2, and half a milliamp through 4.7 kΩ is about 2.3 V. That is close to the 2.4 V triangle in Figure 4-10.
Figure 4-12 plots the tail current against the common-mode level. It shows the two meter readings, the calculated line and the two levels that the 555 uses.
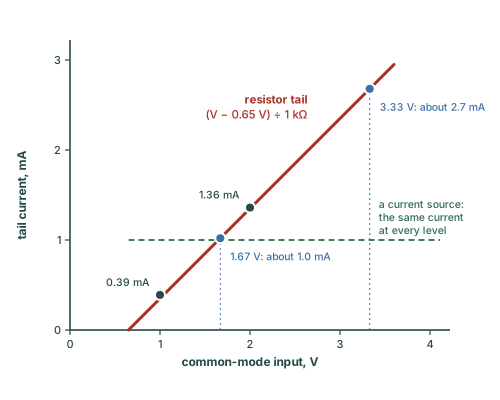
The meter showed the tail current more than tripling over one volt of common-mode level. This matters because the NE555 compares its timing signal with references at one third and two thirds of the supply. At 5 V, those references are 1.67 V and 3.33 V. The resistor-tail calculation gives about 1.0 mA and 2.7 mA at those levels. That large change in bias current affects the gain and the switching behaviour. At the higher level, this simple pair also saturates with its present collector resistors, so the calculation alone cannot give its output.
A current source would hold the tail current almost constant over its operating voltage range. That is the dashed line in Figure 4-12, and Experiment 5 builds one from two more transistors.
Experiment 5 starts from the board of Figure 4-2. So restore the board now, with these moves.
This experiment added the reference input, and the pair showed no clear thermal drift at the scale of Figure 4-7. The wide transition remains, and this experiment found a new limitation in the resistor tail.
| # | Flaw | What it means | Found | Status |
|---|---|---|---|---|
| 1 | No reference input | The threshold is the transistor's own 0.6 V. Nothing outside the circuit sets it. | Experiment 3 | Fixed here the differential pair |
| 2 | Wide transition | The output needs a band of input to travel from high to low: about half a volt with one transistor, about a quarter of a volt with the pair. | Experiment 3 | Open until Experiment 6 |
| 3 | Thermal drift | The base-emitter voltage falls about 2 mV per degree, and the threshold falls with it. | Experiment 3 | Reduced here two matched transistors drifting together |
| 4 | Tail current follows the common-mode level | A resistor tail passes more current as both inputs rise, and the output moves with it. | Found here | Open until Experiment 5 |
Every reference in this experiment came from the power supply. You can also make a reference from resistors. Start from the board of Figure 4-2. Set power supply output 2 to OFF, and remove its leads from 13c and from the top ground rail at column 16. On a free part of the board, build the divider from Experiment 2 with the three additional 4.7 kΩ resistors. Connect it between the +5 V rail and the ground rail.
Connect the junction one resistor above ground to 13c. The unloaded divider gives about 1.67 V, and the base current of Q2 can reduce that voltage. Set power supply output 1 and the function generator to ON. Measure the reference at 13c, and measure the threshold again. Compare them with the readings from power supply output 2.
The reference now comes from the supply of the board, as in the NE555. Experiment 7 fits this divider on the transistor board, and Experiment 9 measures it.
You can also warm one transistor more than the other. Aim the heat gun at Q1 only, from the side away from Q2. Unequal heating should move the threshold more, because the two junction voltages then change by different amounts.
1. V+ is at 2.0 V and V− at 1.6 V. Where does most of the tail current flow?
V+ is 0.4 V higher, so conduction is concentrated in Q1. Q2 carries almost no current, so its collector rises towards +5 V. The current in a resistor tail depends on the emitter voltage. It is approximately constant only over a small input range.
2. Why should warming one transistor move the threshold more than warming both together?
At a given collector current, warming a transistor lowers the base-emitter voltage that it needs. Matched transistors warmed together change by similar amounts, so the input difference needed to balance them changes little. Unequal heating changes that difference more. Matching and a shared temperature improve the cancellation. So integrated pairs are made close together on one piece of silicon.
3. Both inputs are tied together and raised by one volt. With a 1 kΩ resistor for a tail, the tail current…
A resistor passes the voltage across it divided by its value. When both inputs rise, the emitters rise by the same amount. So the voltage across the 1 kΩ increases by a volt, and the current by a milliamp. The meter showed this. So Experiment 5 replaces the resistor with a circuit that holds its current constant.
You added a second transistor to the comparator of Experiment 3 and gave it a reference input. With the reference at 1.67 V, the output rose between 1.74 V and 1.96 V of input. With the reference at 2.67 V, the rise started near 2.8 V. Under the heat gun, the single transistor of Experiment 3 moved 0.26 V. The pair showed no clear movement at the scale of Figure 4-7. Similar changes in the two junction voltages should largely cancel in the comparison.
Then you joined the inputs and found that the circuit responds to their common level. The output swung 2.4 V from a signal with no difference in it. The meter traced this to a tail current that rose from 0.39 mA to 1.36 mA.
The tail must keep its current almost constant as the emitter voltage changes, and a resistor cannot do that. Experiment 5: The Current Mirror builds a current source from two transistors, fits it under the pair and repeats the common-mode test.