Full Stack Electronics · Stage Three · Experiment 3
Build a comparator from one transistor and put it to the test.
In Experiment 2 you built a working timer from two chips and two transistors, and measured the signals between its blocks. The LM393 did the comparing, and it is still a sealed chip. Stage Three builds that comparison from transistors. Experiments 3 to 8 build the two comparators, and Experiment 7 also fits Experiment 2's divider on the transistor board. Experiment 9 measures that divider, and Experiments 10 to 13 add the latch and the reset. At the end, the whole 555 is separate parts on your breadboard.
A comparator switches its output when one input voltage crosses another. A transistor on its own does something similar. Below about 0.6 V on its base, the transistor is off. Above about 0.6 V, the base-emitter junction conducts, and current flows through the transistor. So a transistor is a simple comparator with one input, and it compares that input against 0.6 V. This experiment starts there: one transistor, two resistors and the oscilloscope on the collector.
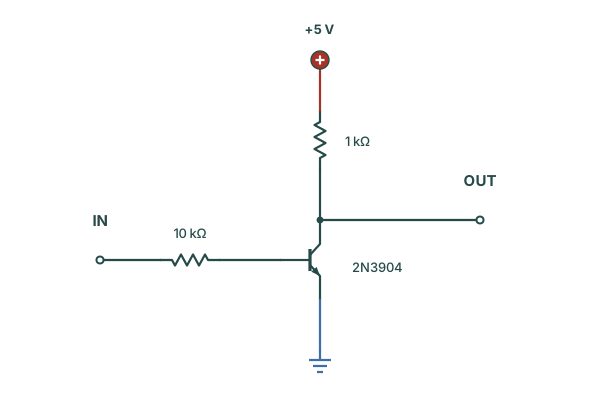
Start with the transistor and its two resistors. Figure 3-1 shows the circuit, which is called a common-emitter stage because the grounded emitter is common to the input and the output. The 10 kΩ resistor feeds the base. The 1 kΩ resistor connects the collector to +5 V. The emitter connects directly to ground. The input is the free end of the 10 kΩ resistor, and the output is the collector.
Figure 3-1 has an input, but nothing drives it yet. In Experiment 2 you set a reference with power supply output 2 and read a meter. That method gives one voltage at a time. To measure a switch, you need its output at every input voltage: where the output changes, and how much input the change needs. A function generator sweeps the input for you. It makes a repeating waveform with the shape, frequency and levels that you set.
For this job, use a slow triangle wave from 0 V to 2 V at 100 Hz. Each input voltage then arrives in order, up and down, again and again. The two oscilloscope traces share one time axis. When the output switches, read the input trace at the same instant: that reading is the threshold. The keystrokes for the SDG1062X are in the function generator reference. Read it once before you start.
The output of the function generator must reach two places: the input of the circuit and oscilloscope channel 1. Then you can read the input and the output side by side. Figure 3-2 shows the connections. A BNC T-piece sits on the oscilloscope channel 1 input. One arm takes the BNC cable from the function generator. The other arm takes a lead that ends in two mini-hook wires: red to the input of the circuit, black to ground.
Oscilloscope channel 1 thus shows the voltage that the circuit receives, measured at the oscilloscope. The display of the function generator shows only the voltage that it intends to deliver. Oscilloscope channel 2 is an ordinary probe on the collector. All black leads and ground clips connect to the ground rails of the breadboard. The function generator and the oscilloscope already share a ground through their mains plugs.
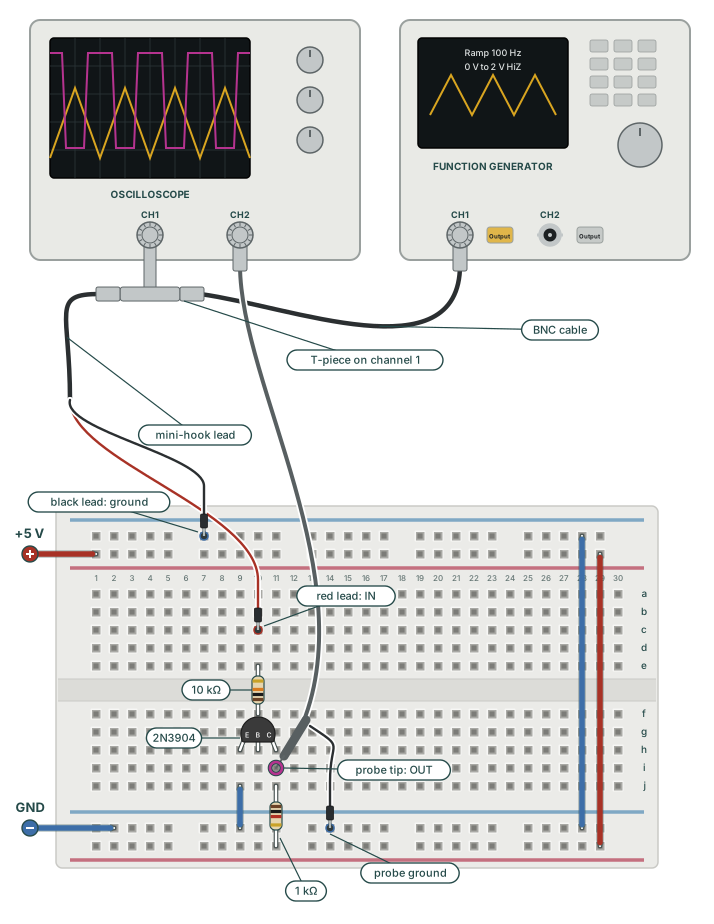
Before you take readings, set the output load of the function generator to HiZ. On the SDG1062X, hold the Output key of the channel for two seconds, or use Utility → Output Setup → Load → HiZ. With a 50 Ω load setting, the function generator doubles its internal voltage to allow for that load. A breadboard draws almost no current, so each level that you set arrives twice as large. If the measured triangle is twice the range that you set, check this setting. Check it at the start of each session, because some settings changes reset it.
With the function generator running, oscilloscope channel 2 shows what the transistor does with each input voltage. Watch the magenta output while the yellow input rises. At first, the output stays near +5 V. As the input passes through a small region above half a volt, the output falls towards ground. When the input falls again, the output rises again. So the transistor converts a smooth input into two output levels, with a transition between them.
This circuit is already a simple comparator. With the input below the switching region, the transistor is off and the output is high. With the input above that region, the transistor is on and the output is low. The decision is inverted: more input gives less output. But the circuit has no way to set where the switching region sits, or to hold it there.
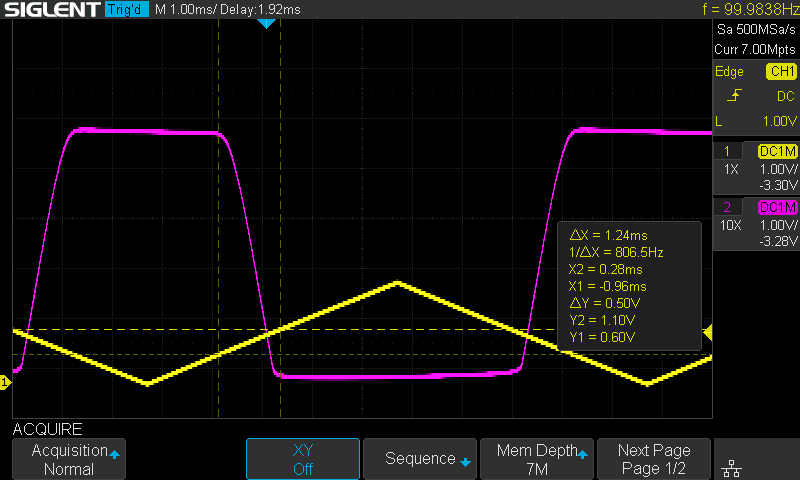
Figure 3-3 shows three things: a high output, a fall and a low output. The currents in the transistor cause each one. With the input near 0 V, no base current flows, so no collector current flows. With no current through the 1 kΩ resistor, there is no voltage across it. So the collector stays at the supply voltage, +5 V. That is the high output level.
Now the input rises. When the base is about 0.6 V above ground, base current flows in through the 10 kΩ resistor. The transistor then passes a collector current about a hundred times larger. That current flows through the 1 kΩ resistor and, by Ohm's law, makes a voltage across it. So the collector is below +5 V by that voltage. More input gives more base current, more collector current and a larger voltage drop: the output falls.
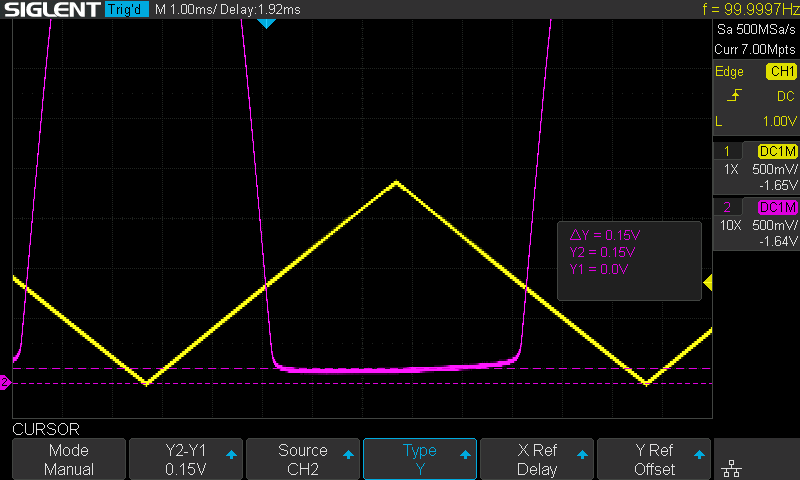
The fall stops when the transistor is fully on. Even then, a small voltage stays between collector and emitter, and that voltage is the low output level. In Figure 3-3 this level seems to sit on the ground line. Set oscilloscope channel 2 to 500 mV/div. Put one voltage cursor on the ground marker and the other on the flat bottom of the magenta trace. The gap is then visible, and mine reads 0.15 V.
A transistor in this state is saturated, and a few tenths of a volt is typical. The 2N3904 datasheet specifies a maximum of 0.2 V at 10 mA collector current and 1 mA base current. The datasheet guarantees that limit only at those test conditions. This circuit operates at different currents.
The high level, the fall and the low level are the three operating regions of the transistor. Each sweep of the triangle takes the transistor through all three, and the magenta trace shows each one. Datasheets and textbooks use these names.
A comparator should spend as little of its input range as possible in the active region. In that region, the output is neither high nor low.
The three regions describe how the transistor switches. The next question is what it compares against. A comparator such as the LM393 compares two input voltages: one is the signal, and the other is a reference that you set. In Experiment 2 the LM393 compared the capacitor voltage against 1.67 V and 3.33 V. Those levels came from the divider, which connected to the second input of each comparator.
Figure 3-1 has no place for such a level. The base is the only input, and the 10 kΩ resistor that feeds it carries the signal. So the reference of this comparator is fixed. It is the 0.6 V of the base-emitter junction, it comes with the transistor, and no terminal can change it.
Figure 3-3 already shows where the circuit switches. The fall starts at 0.60 V, the voltage of the junction itself, and ends at 1.10 V. The extra half volt is mostly the drop across the 10 kΩ resistor as the base current increases. Read your two values in the same way. Different transistors give different results, so the part sets the switching point. The next section measures how cleanly the output switches there.
Flaw 1 is about where the output switches. Flaw 2 is about how cleanly it switches. A comparator should give a yes or a no: high output on one side of the threshold, low output on the other, and nothing between. An ideal comparator needs no input change at all to go from high to low. In Figure 3-3 the fall of the magenta trace slopes. So, for a range of input voltages, the output is neither high nor low.
To measure that range, narrow the triangle to 0.4–1.2 V and keep it at 100 Hz. On the SDG1062X, set LowLevel to 0.4 V and HighLevel to 1.2 V. The fall then fills more of the screen.
Press the Cursors button on the oscilloscope. Set the cursor mode to Manual, the type to XY and the source to oscilloscope channel 1. Put X1 where the output starts to fall, and X2 where it reaches the bottom. Then move Y1 and Y2 onto the yellow trace where it crosses each X cursor. The Y readouts are the input at the start and at the end of the fall. Y2−Y1 is the width of the transition.
Use the same endpoints when you repeat this measurement on later circuits.
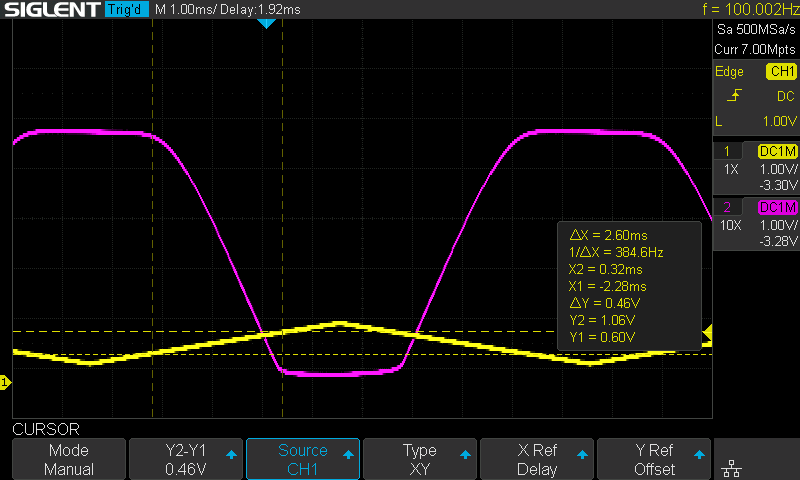
So the transition is about half a volt wide. Inside that band, the output passes through every voltage between high and low. A slowly charging timing capacitor would stay in that band for a long time. The next circuit must then decide which of those voltages counts as a switch. So the second requirement, after a reference that we can set, is a transition as narrow as possible.
Figure 3-5 reads the band from two traces against time. X-Y mode shows the same band as one line, with output plotted against input. On the SDS1104X-E, press Acquire and set the XY softkey to On. Set oscilloscope channel 1 to 200 mV/div, so that the input fills the width. Turn the oscilloscope channel 1 position knob to centre the curve. The line on the screen is the transfer curve of the circuit.
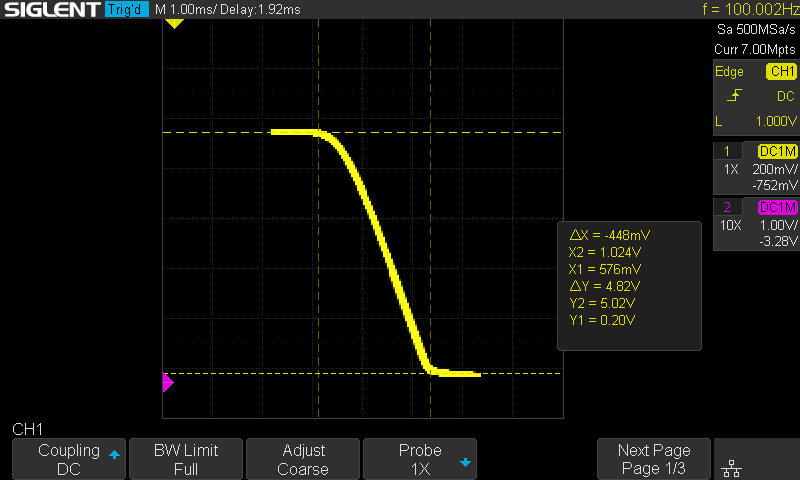
Figure 3-6 is the transfer curve of this circuit. A transfer curve shows the output for each input voltage, without time. It has two settled regions, and the active region of the transistor joins them.
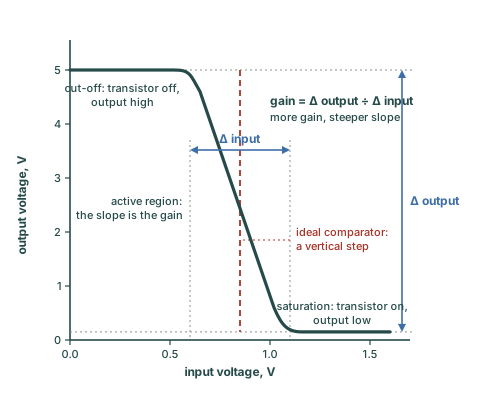
Voltage gain is the output change divided by the input change. With input on the horizontal axis, more gain gives a steeper transition. An ideal comparator would switch along a vertical line. Figure 3-7 marks these features on a drawn curve.
Flaws 1 and 2 are about where and how cleanly the output switches. Flaw 3 is about whether the switching point stays in one place. A comparator should keep its threshold where it was set, at any temperature of the room or the part. The timing of the 555 depends on its two references staying at one third and two thirds of the supply. So the third test heats the transistor and measures where the output switches.
Return the oscilloscope to its normal time display: press Acquire and set the XY softkey to Off. Set both channels to 1 V/div and the timebase to 500 µs/div, as in my capture. Restore the triangle to 0–2 V. Trigger on oscilloscope channel 1, rising, so that the input stays in one place on the screen. Then any movement comes from the output.
Persistence keeps earlier traces on the screen. Press Display/Persist, press the Persist softkey and turn the Universal Knob to select Infinite. For colour grading, press the Color softkey in the same menu and set it to On.
For this test, the threshold is the input voltage where the magenta trace leaves its high shelf. Put an X cursor there. Read oscilloscope channel 1 at the same instant with a Y cursor. Record that input voltage at room temperature.
Now warm the transistor for a few seconds. Use a heat gun on its lowest setting, or a hair dryer, from a hand's width away. Keep the air off the rest of the board. Stop before the plastic of the transistor softens. When the warm trace settles, put the X cursor where it leaves the high shelf, and read oscilloscope channel 1 again.
Then stop heating, and watch the fall return as the transistor cools. Persistence shows the movement. Compare the cold and warm readings at the same point, where each trace leaves the high shelf.
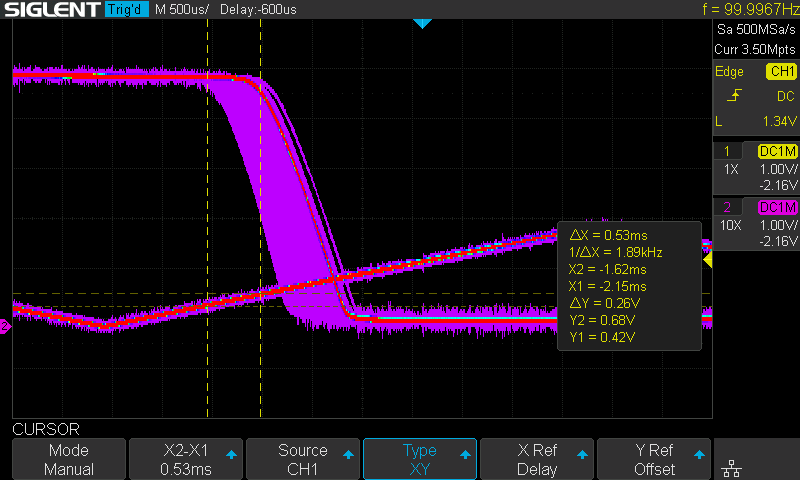
Same sweep, warmer transistor, lower threshold, and the threshold returns as the part cools. On my board, the start of the fall moved from 0.68 V of input down to 0.42 V: a shift of 0.26 V. My cold reading here is 0.08 V higher than the 0.60 V of Figure 3-3, and these two captures do not show why. A timer built on this comparator would run at a different rate on a warm day. So the third requirement is a threshold that stays in one place as the temperature changes.
The base-emitter junction is one cause. The base-emitter voltage needed for a given collector current falls as the transistor warms, typically by about 2 mV per degree Celsius. Changes in current gain can also change the drop across our base resistor. At 2 mV per degree, a 0.26 V shift needs about 130 degrees of warming. I did not measure the temperature of the transistor. So this capture cannot separate the junction from other causes, and it gives no drift rate in millivolts per degree.
The circuit makes a decision. But the transistor sets its threshold, its transition is wide, and its reference moves with heat.
| # | Flaw | What it means | Found | Status |
|---|---|---|---|---|
| 1 | No reference input | The threshold is the transistor's own 0.6 V. Nothing outside the circuit sets it. | Found here | Open until Experiment 4 |
| 2 | Wide transition | The output needs a band of input to travel from high to low: about half a volt with one transistor, about a quarter of a volt with the pair. | Found here | Open until Experiment 6 |
| 3 | Thermal drift | The base-emitter voltage falls about 2 mV per degree, and the threshold falls with it. | Found here | Open until Experiment 4 |
Much of the width in flaw 2 probably comes from the 10 kΩ base resistor, and one substitution tests this. Replace the 10 kΩ base resistor with a 1 kΩ resistor, and draw the transfer curve again. The band should be about a third as wide. The transistor needs about 50 µA of base current to reach 5 mA. That current makes 0.5 V across 10 kΩ, but only 0.05 V across 1 kΩ.
But the input must now supply ten times the base current. A function generator can supply it. A timing capacitor cannot: at 3.33 V, a 1 kΩ base resistor takes more than 2 mA from the circuit that drives it. In Experiment 1, the charging current of the timing loop stays below about 0.17 mA once the timer runs. So the fix for the wide transition must increase the gain without taking more current from the input.
1. As a 555 comparator, this circuit's disqualifying limitation is that…
The comparison happens against VBE, fixed near 0.6 V by the silicon, plus the drop across the base resistor. The two thresholds of the 555, 1.67 V and 3.33 V, must come from outside the comparator. Experiment 4 arranges this. The latch of the timer accepts an inverted output, as it did from the driver in Experiment 2.
2. The band you measured corresponds to the transistor crossing…
The amplifier region is between cut-off and saturation. The gain of the circuit sets how much input it takes to cross that region. A gain of about 11 means about 5 V ÷ 11, or about 0.45 V of input. More voltage gain makes that input band narrower. Switching speed is a separate measurement.
3. Warming the transistor moved the threshold lower because…
At a given collector current, VBE typically falls by about 2 mV/°C. The drop across the base resistor can also change. A circuit whose reference is a VBE moves with the temperature. The fix is two matched transistors that drift together, so that much of their shared drift cancels. That circuit is the differential pair of the next experiment.
You built a comparator from one transistor and two resistors, and you examined three limitations. It switches where its own base-emitter junction sets the threshold: between 0.60 V and 1.10 V of input on my board. It has no way to set 1.67 V. Its output needs about half a volt of input to go from high to low. And warm air moved its switching region down by 0.26 V on my board.
So a comparator must do three things better. It must take its reference from an input, switch inside a narrow band, and stay in place as the temperature changes.
Experiment 4 fixes the missing reference input and should reduce the drift. It joins two transistors at their emitters and feeds them one shared current. The base of the second transistor becomes the reference input. When the two transistors share a temperature, much of the drift should cancel. Experiment 4: The Differential Pair compares two input voltages by sharing a current between two transistors.