Full Stack Electronics · Stage Four · Experiment 21
The last step from the breadboard to a printed circuit board. Put the board in place of the NE555 of Experiment 1, switch it on behind a current limit, and measure it as you measured the chip.
Experiment 20 ended with 46 parts on the board, and each joint passed the inspection. No current has gone through the board yet. Some faults show only when current flows. Examples are a short under a part, a joint that does not conduct, and a PNP in an NPN position. A short across the supply can burn a part or a track in a few seconds. So this experiment checks the supply pins with a multimeter, and then switches the board on with a current limit. The circuit is the blinker of Experiment 1, with the board in place of the NE555. The oscilloscope then measures the board as it measured the chip: the period and the levels of the output. Last, the experiment tests RESET, because the blinker does not use it.
The lead named a short across the supply as the fault that does the most damage. A multimeter finds that short before any voltage goes on the board. In continuity mode, the meter beeps when the resistance between its probes is low.
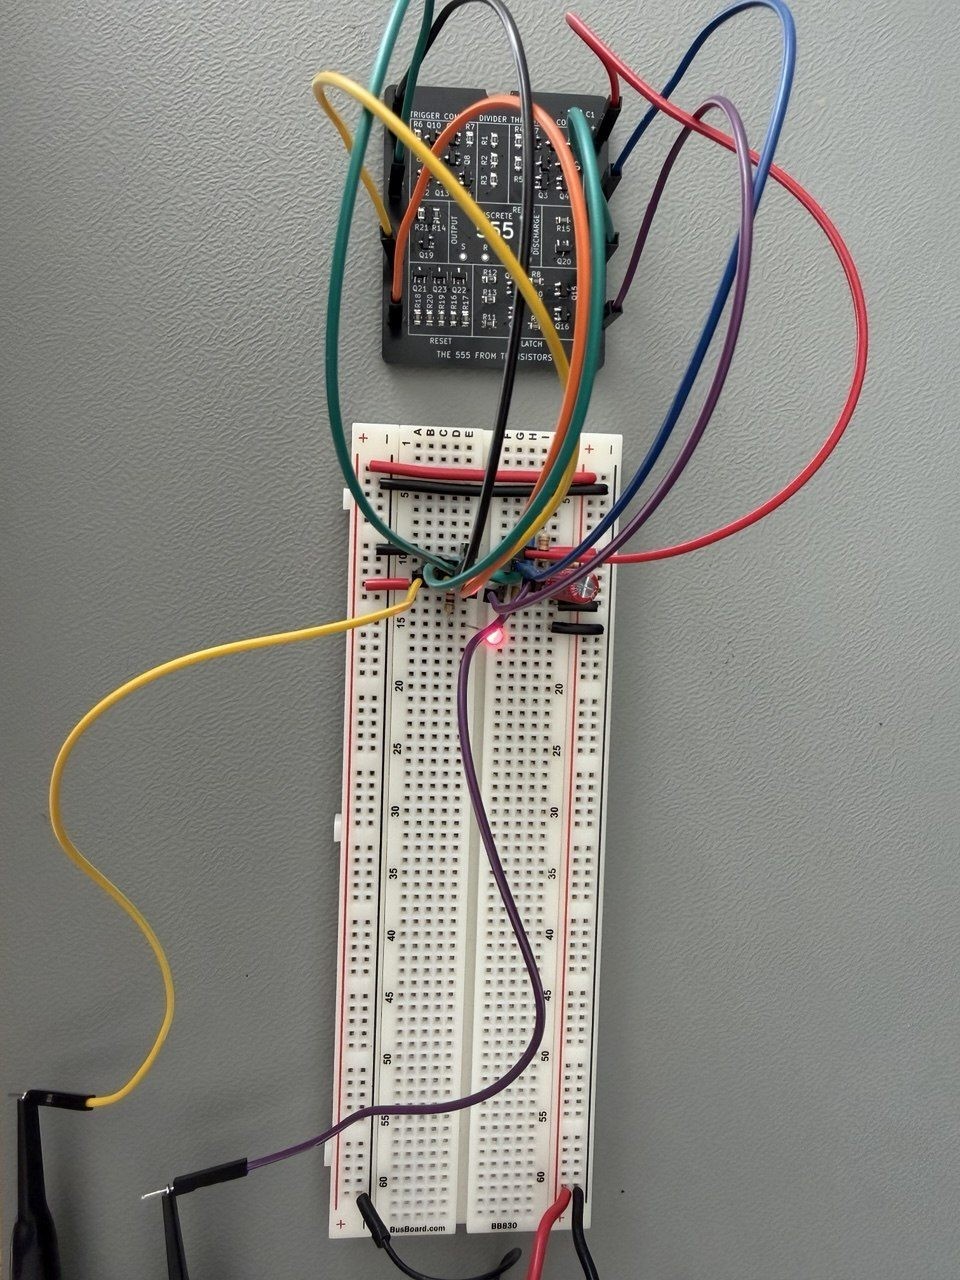
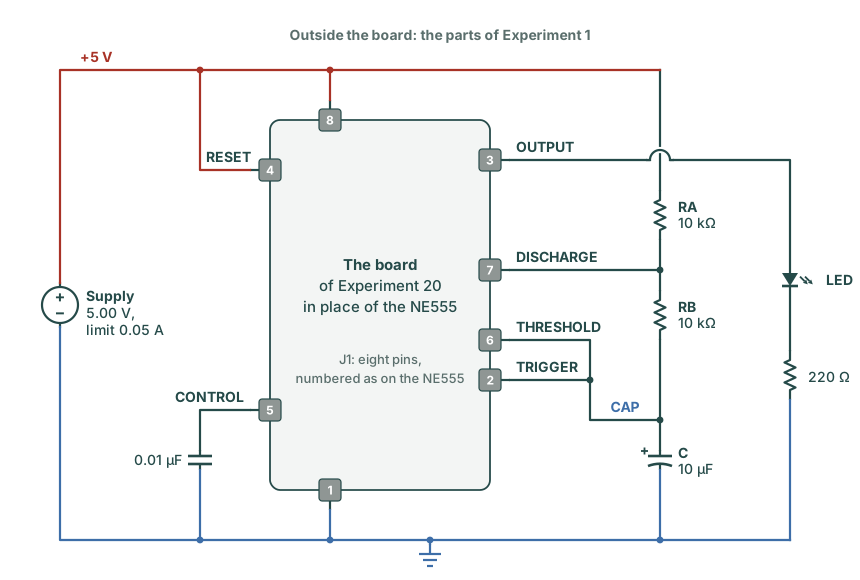
The supply pins are not shorted, so the board can go into a circuit. The circuit is the blinker of Experiment 1. J1 gives each pin of the board the number of the same pin on the NE555, as Experiment 19 checked. So a lead from each board pin goes into the hole of the NE555 leg with the same number. All the other parts stay where they are. Figure 21-1 gives the circuit.
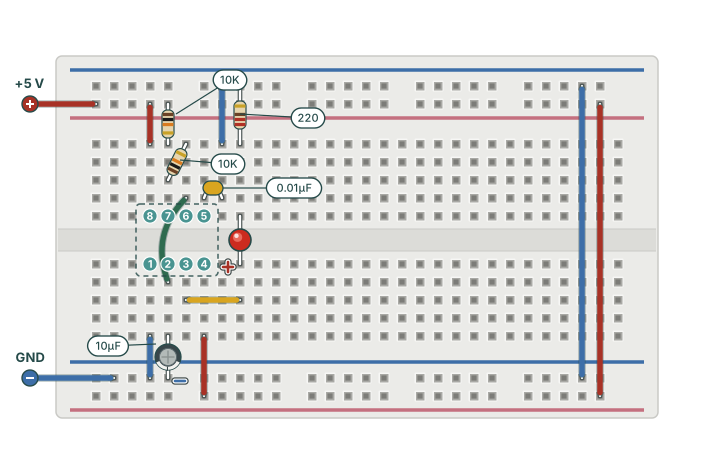
This page calls the timing parts RA, RB and C, as Experiment 12 did. Experiment 1 called them R1, R2 and C1, but the board uses those names for its own parts. Figure 21-2 shows the breadboard without the NE555. A green marker is on each hole where a leg of the chip was. The number on the marker is the pin number.
| Pin | Name on the board | Hole | Connects to |
|---|---|---|---|
| 1 | GND | 4f | The ground rail, through the blue wire |
| 2 | TRIG | 5f | C, and pin 6 through the green wire |
| 3 | OUT | 6f | The LED, through the yellow wire |
| 4 | RST | 7f | The +5 V rail, through the red wire |
| 5 | CTRL | 7e | The 0.01 µF capacitor |
| 6 | THR | 6e | RB, and pin 2 through the green wire |
| 7 | DIS | 5e | RA and RB |
| 8 | +5V | 4e | The +5 V rail, through the red wire |
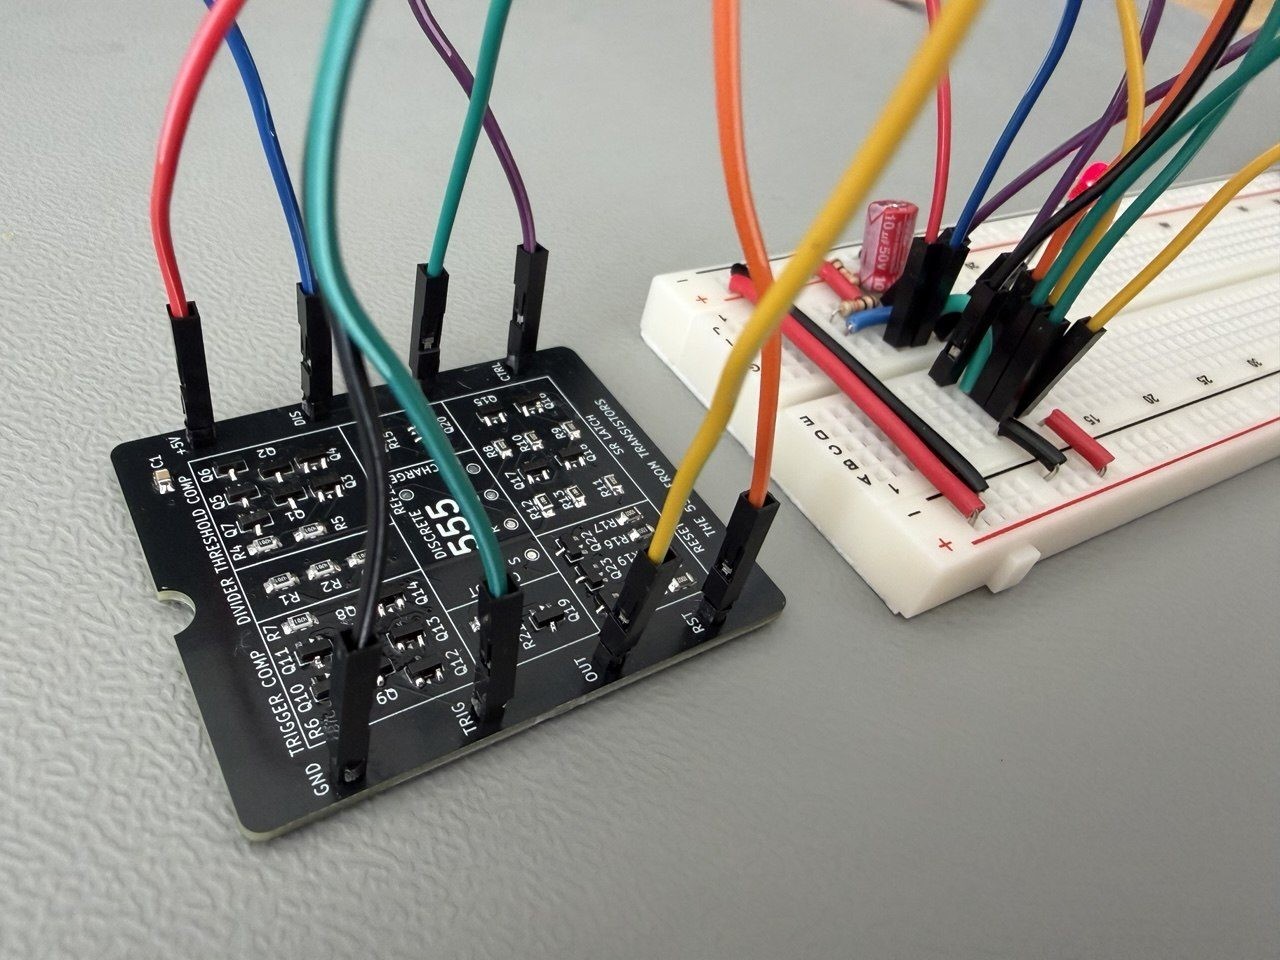
Each lead is in its hole. The supply goes on last, with a limit on its current. In constant voltage mode, CV, the supply holds its output at the set voltage. If the circuit takes more than the limit, the supply changes to constant current mode, CC. It then holds the current at the limit and lets the voltage fall. So a short gets no more than the limit, and the voltage across it falls.
If the display shows CC, or the voltage falls below 5.00 V, disable the output at once. Do not increase the limit. The limit stopped a fault, and more current can burn the part that has the fault. Find the short under the microscope. Then do the checks of this experiment again from the start.
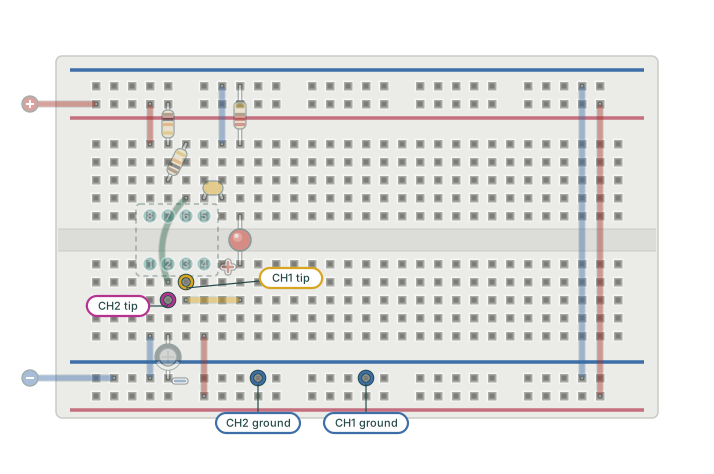
The supply holds 5.00 V and the LED blinks. Now the oscilloscope measures the board, with the probes and the settings of Experiment 1. Figure 21-4 shows the probe points.
| Oscilloscope channel | Tip or hook | Ground clip |
|---|---|---|
| Channel 1: OUT | Hole 6g, the column of pin 3 | The ground rail |
| Channel 2: CAP | Hole 5h, the column of pin 2 and C | The same ground rail |
The board copies the NE555, so expect the readings of Experiment 1. By calculation, RA, RB and C give a period of 208 ms. OUT is high while C charges and low while C discharges, as on pin 3 of the NE555. Experiment 14 moved Q19's base from Q to Q̄ on the board for that reason.
| Measurement | Calculation | NE555, Experiment 1 | My board |
|---|---|---|---|
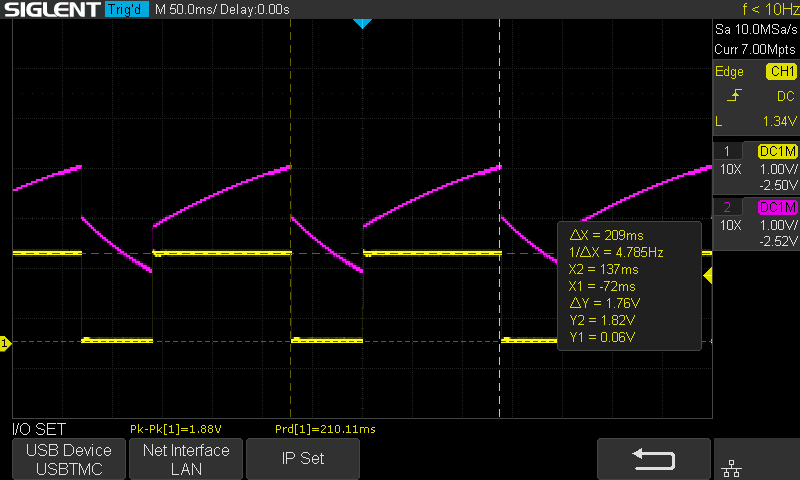
| Period | 208 ms | 200.46 ms | 210.11 ms |
| Frequency | 4.81 Hz | 4.99 Hz | 4.76 Hz |
| OUT while C charges | High | High, about 3.7 V | High, 1.82 V |
| OUT while C discharges | Low | Near 0 V | 0.06 V |
The board runs at 210.11 ms, 1.0 % from the calculation. The phase of OUT is that of pin 3. The CAP trace in Figure 21-5 also jumps by about 1 V at each switch, and the NE555 trace of Experiment 1 does not. I have not found the cause of these jumps yet, so this page does not take the turning points of CAP from this capture. One reading is far from the NE555: the high level of OUT, 1.82 V against about 3.7 V.
The last section found OUT high at 1.82 V. A bad joint on Q19 could be the cause, but the circuit gives a simpler cause. Q19 can pull OUT down to 0 V, and it cannot pull it up. On the board, R21 pulls OUT up, as Experiment 14 explained. Figure 21-6 shows the output stage while C charges, with the LED on OUT.
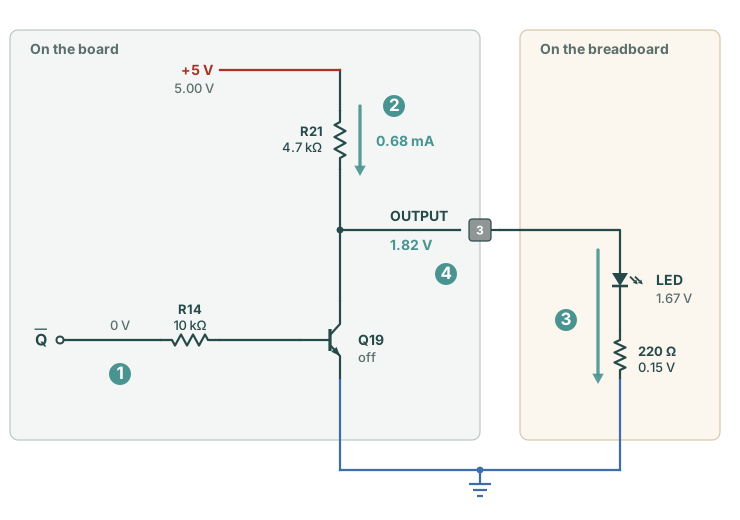
The NE555 drives pin 3 high through its own transistors. Experiment 14 gave up to 200 mA for pin 3, from the TI datasheet. With that much current available, the LED did not hold pin 3 down, and it stayed at about 3.7 V. R21 gives at most 1.06 mA, the current with OUT at 0 V. So the steps give a prediction. Remove the LED, and nothing takes the current of R21 except the probe. Then OUT rises to almost 5 V.
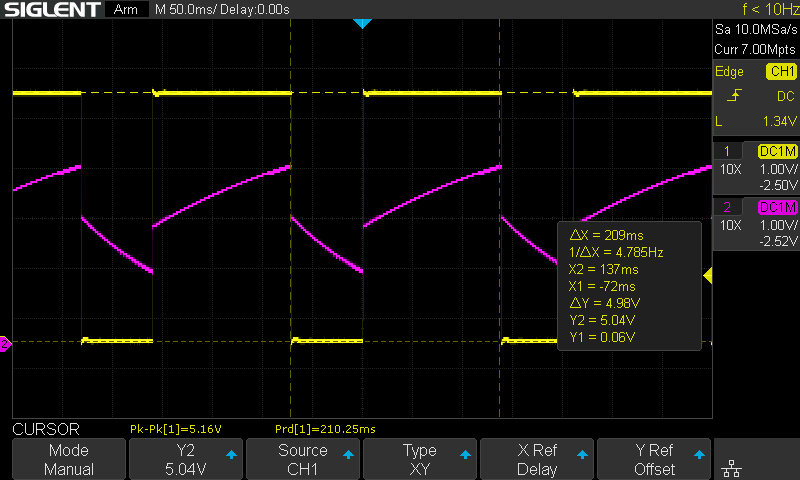
Without the LED, OUT is high at 5.04 V, the supply voltage as this oscilloscope reads it. The low level stays at 0.06 V, where Q19 holds OUT. The period moved from 210.11 ms to 210.25 ms, 0.07 %. So the LED set the high level, and the output stage works. The LED does not change the timing.
On an open collector output, the pull-up resistor and the load set the high level. The resistor and the load are in series between +5 V and ground, so the same current flows through both. The high level is the supply voltage minus the voltage across the resistor:
VOUT = 5.00 V − I × 4.7 kΩ
With no load, I is almost 0 and OUT is at the supply. With the LED, I is 0.68 mA and OUT is at 1.82 V. With OUT shorted to ground, I is 1.06 mA. A smaller pull-up gives more current to the load. It also gives more current into Q19 while Q19 holds OUT low.
The output stage works. One block of the board has done nothing yet: the reset block. In the blinker, the red wire holds RESET at +5 V, so the timer runs and the reset block stays off. A blink that works does not show that reset works. So the test moves RESET to 0 V.
Experiment 14 gave the steps of a reset on the board. Q22 holds Q at 0 and Q23 holds S at 0. Q̄ is then 1, so Q19 holds OUT low and the LED is off. Q20 empties C. In the simulation of Experiment 16, OUT stayed at 0.04 V during the reset, and the first charge after it took 203.8 ms. On my board the LED went off and stayed off while RESET was at 0 V. It blinked again after the release. I checked this by eye only, with no capture. To see the reset on the oscilloscope, expect OUT near 0 V and CAP falling towards 0 V while RESET is low.
The reset worked, so each block of the board has now worked. The comparators, the divider, the latch and the output work in each blink. The discharge switch works in each fall of CAP, and the reset block worked in the test. This board is the last of five builds of the same timer in this course. Figure 21-8 gives the period of each build. Each build used 10 kΩ, 10 kΩ and 10 µF.
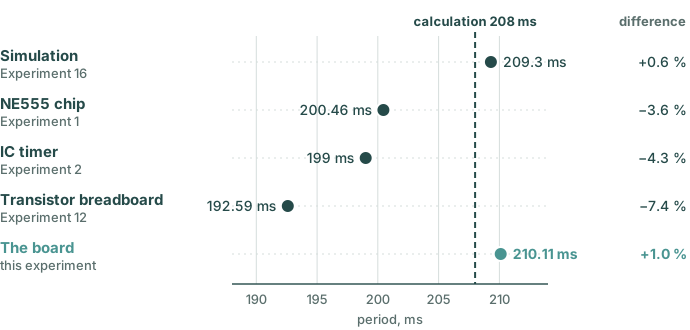
All five builds are within 8 % of the calculation. Part tolerances can move a period by that much. A typical electrolytic capacitor has a tolerance of ±20 %. The board is nearest to the calculation, at 1.0 %, and 0.4 % from the simulation of its own schematic. The board and the NE555 ran on the same breadboard with the same RA, RB and C. Their periods differ by 4.8 %. These captures alone do not show the cause.
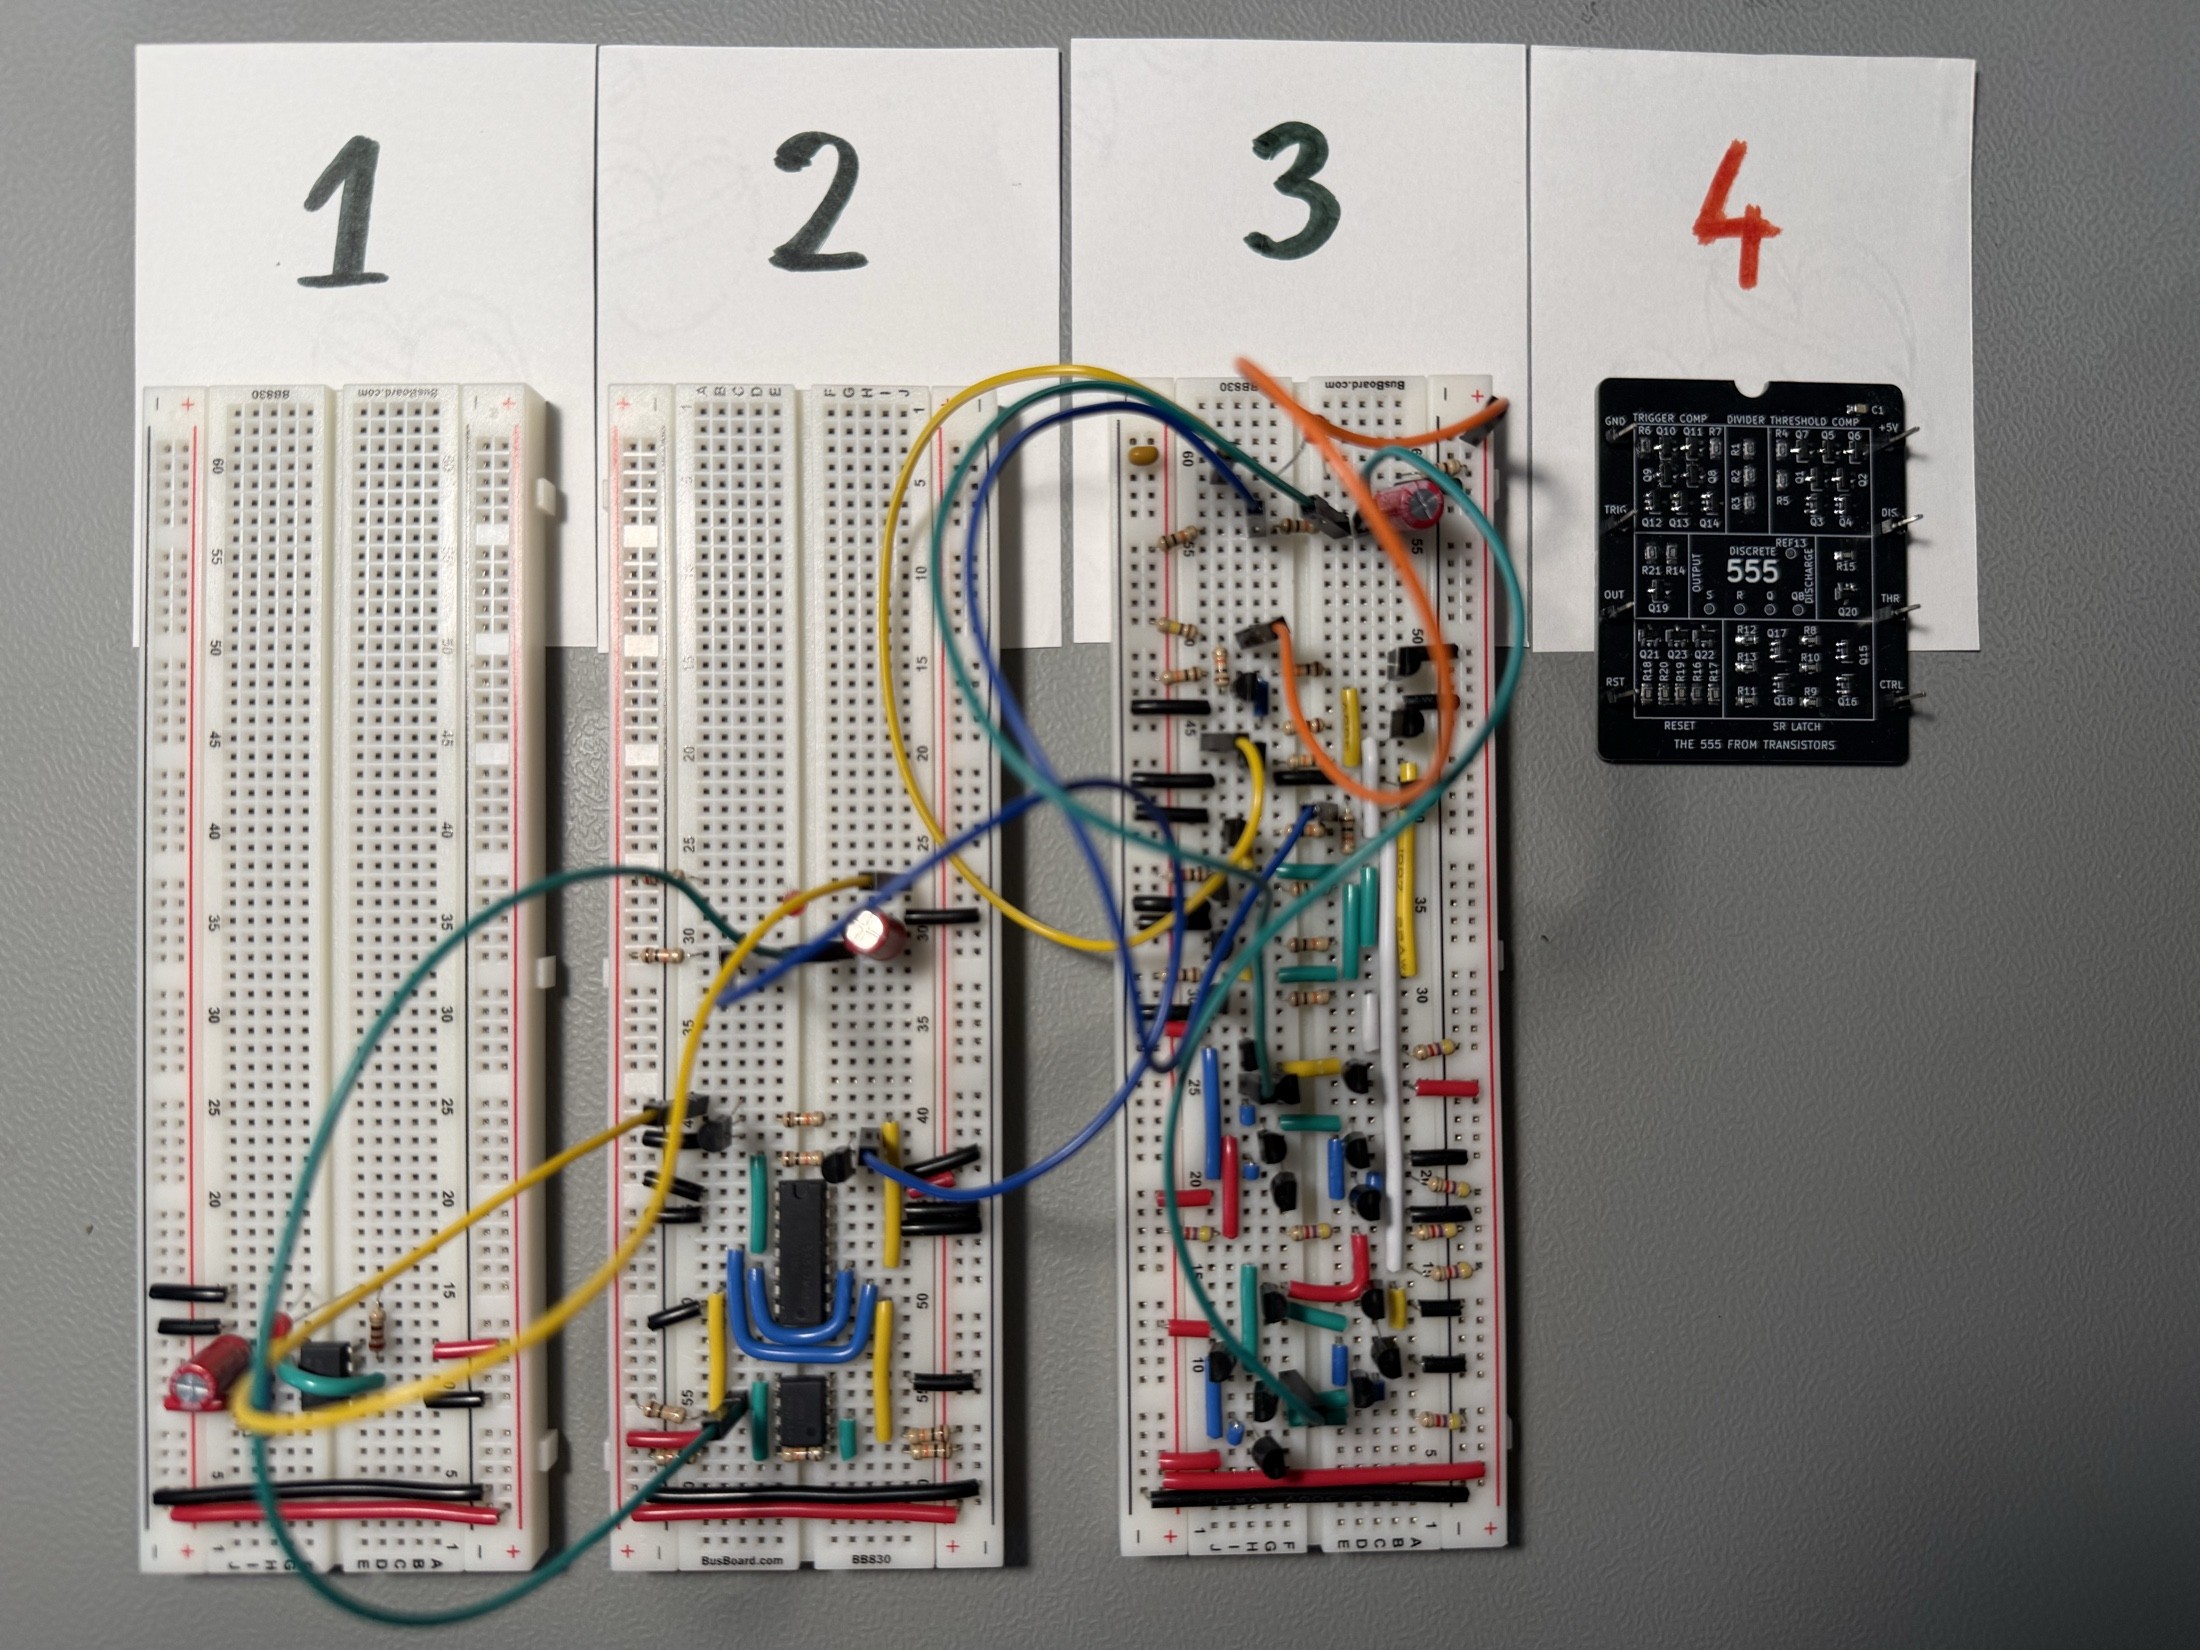
Three questions on this experiment. They ask what to do when the limit stops the current, why OUT is low on the board, and why the reset needs its own test.
1. At switch-on the supply shows CC and the voltage falls. What do you do?
CC means the circuit takes more than the limit. The limit stopped the fault. More current can burn the part that has the fault, so disable the output and find the short.
2. With the LED on OUT, the high level of OUT is 1.82 V. Without the LED, it is 5.04 V. What is the cause?
Q19 cannot pull OUT up. R21 does, through 4.7 kΩ. The LED conducts from about 1.8 V and takes all the current of R21. Without the LED, nothing takes that current, and OUT rises to the supply.
3. Why does RESET need its own test?
The blink uses each block except reset. Only RESET at 0 V shows that Q21 to Q23 hold the timer.
The board passed each test. The supply pins have no short, and the board takes 0.01 A. It blinks the LED of Experiment 1 at 210.11 ms, with OUT high while C charges, and RESET stops it. That is the last step from the breadboard to the board. The Epilogue compares the result with the aims of the Introduction, and gives what comes next.