Sim.Pins gives the model pin for each pin of the symbol, and the model takes its pins in the order C, B, E.Full Stack Electronics · Stage Four · Experiment 16
The third step from the breadboard to a printed circuit board. Run the KiCad schematic in KiCad's simulator with the outside parts of Experiment 12. Compare its timing with your breadboard, and test the reset of the board.
Experiment 15 ended with the master schematic in KiCad and zero errors from the electrical rules checker, ERC. ERC checks that each connection obeys the rules of connection. It does not check that the circuit runs as a timer. For this board that is important, because the board is not a copy of the breadboard. Experiment 14 made five changes, and no breadboard has run them. An error in them shows only when the boards come back from the factory, some weeks after the order. A simulator can test the changes before the order. It calculates the voltage on each net of the schematic, step by step in time, and plots the result as an oscilloscope does. This experiment connects the outside parts of Experiment 12 to a copy of the KiCad project and runs it in KiCad's simulator. Then it compares the timing with your breadboard and tests the reset of the board. The name of the experiment comes from the first power-up of a new circuit, the smoke test. Here the first power-up is in the simulator.
The lead said that a simulator calculates the voltage on each net. It starts from the netlist that KiCad makes from the schematic. Each part gives a rule for the currents in its pins. For a resistor the rule is Ohm's law. For a capacitor, the current changes the voltage across it. For a transistor, the rule is its model: a set of equations with measured constants. The simulator finds the voltages that obey all the rules at one instant. Then it moves the time forward by a small step and calculates again. KiCad calls this a transient analysis, TRAN.
KiCad's simulator is ngspice, a free program that comes from SPICE. The box “Where SPICE comes from” gives its history. ngspice needs a model for each symbol and a source for each supply. The table gives what the schematic of Experiment 15 has and what it needs.
| Parts | What the simulator uses | What to do |
|---|---|---|
| R1 to R21, C1 | The value. KiCad finds the model of a resistor or a capacitor from its designator and value. | Nothing |
| Q1 to Q23 | KiCad's built-in NPN or PNP model, from two fields of the MMBT3904 and MMBT3906 symbols | Nothing |
| J1, TP1 to TP5 | Nothing. KiCad has no model for a connector or a test pad. | Exclude them from simulation |
| The 5 V supply, RA, RB and C | Nothing. They are not on the schematic, because on the breadboard they are outside the 555. | Add them as a test bench |
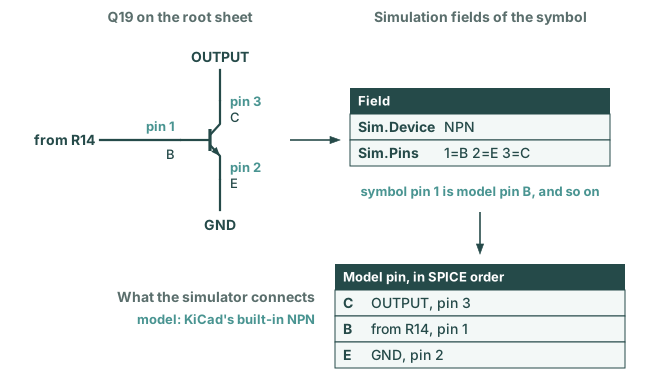
Figure 16-1 shows how the simulator gets a transistor. The MMBT3904 symbol of the KiCad library has two simulation fields. Sim.Device selects KiCad's built-in NPN model. Sim.Pins connects each pin of the symbol to a pin of the model. Pin 1 goes to the base B, pin 2 to the emitter E and pin 3 to the collector C. These are the same pin numbers that go to the pads of the SOT-23 footprint. A wrong pin map connects the right nets to the wrong legs, as a wrong footprint does.
Sim.Pins gives the model pin for each pin of the symbol, and the model takes its pins in the order C, B, E.In the Schematic Editor, double-click a transistor and click Simulation Model… to see the two fields. The tab Pin Assignments shows the pin map. In the simulator, Simulation → Show SPICE Netlist… shows the text that KiCad gives to ngspice, with one line for each part.
KiCad's built-in NPN and PNP models use the default constants of ngspice. They describe a general small transistor with a current gain of 100. They are not a model of the MMBT3904. For this experiment that is sufficient, because RA, RB, C and the divider set the timing. I also ran the simulation with published models of the 2N3904 and 2N3906, the TO-92 versions of the same transistors. The period changed from 209.30 ms to 209.29 ms, and the turning points by less than 5 mV. For currents, speeds and limits, use the model of the part. As the KiCad manual says, semiconductor manufacturers often supply SPICE models of their parts.
The table gave two tasks: exclude J1 and the test pads, and add a test bench. Both change the schematic, so they go in a copy of the project. The test bench joins THRESHOLD and TRIGGER, as the wire from pin 6 to pin 2 did on the breadboard. In the master project, the PCB Editor of Experiment 18 would get that wire as a connection on the board. So the master project stays as it is.
555-sim. In KiCad, open 555-sim/555.kicad_pro, then the Schematic Editor.The copy is now ready for the parts that the breadboard had outside the 555. Figure 16-2 shows them around the schematic. They are the parts of Experiment 12 with KiCad designators. V1 is the 5 V supply, RA and RB are 10 kΩ, and CT is the 10 µF capacitor C. V2 is for the reset test, later in this experiment. CONTROL stays open, as on the breadboard.
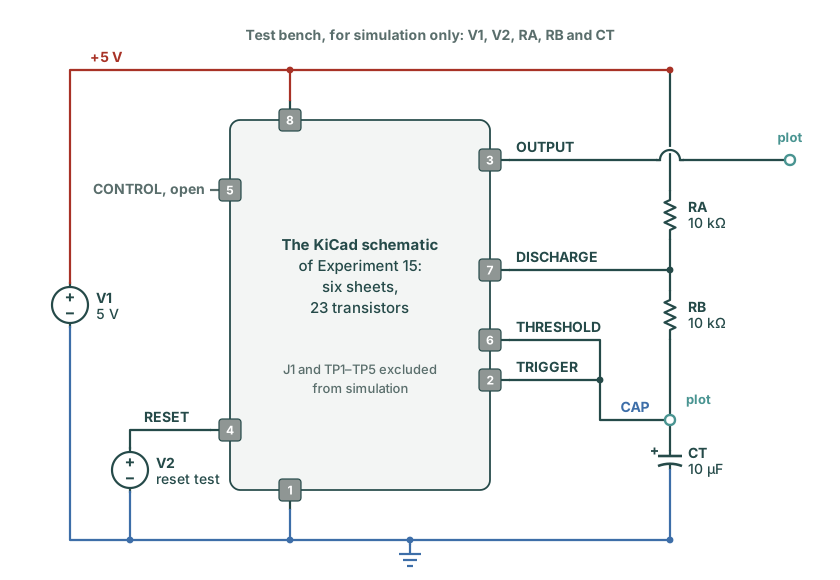
Put the test bench in the empty space at the left of the root sheet, next to the sheet symbols.
VDC, and place the symbol VDC from the library Simulation_SPICE. Press U and type V1. Press V and type 5, the voltage of the source. Press P and connect a +5V symbol to its + pin and a GND symbol to its − pin.R and one C from the library Device. Give them the designators RA, RB and CT, and the values 10K, 10K and 10u. Wire them in a column from a +5V symbol to a GND symbol: RA at the top, then RB, then CT.DISCHARGE on a wire from the point between RA and RB. Put the labels THRESHOLD and TRIGGER on wires from the point between RB and CT. Each label joins its wire to the net with the same name on the root sheet. So the three labels connect the test bench to pins 7, 6 and 2.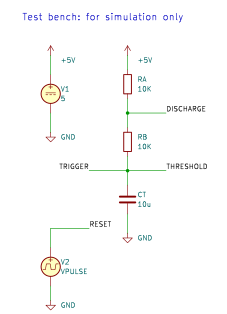
555-sim. V2 at the bottom comes in the reset test. Click to enlarge.With the test bench, the schematic is a complete circuit: the breadboard of Experiment 12 with the five changes of Experiment 14. The simulator runs in a window of its own.
20u for the time step and 1 for the final time, in seconds. Select Use initial conditions, so that each voltage starts at 0 V, as at power-up with an empty C. Click OK.V(/THRESHOLD), which is CAP, and V(/OUTPUT).V(/OUTPUT). Drag the two cursor markers to two rising edges, one period apart. The cursor table gives the time between them. Use the cursors on V(/THRESHOLD) to read the turning points.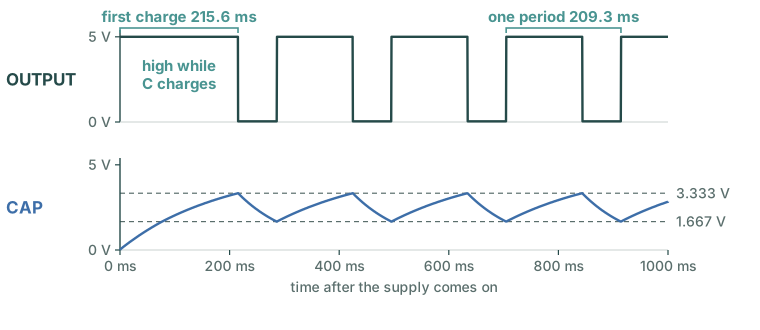
At a time step of 20 µs, one second of the circuit is 50 000 steps. A larger step makes the run faster and the edges less exact. At 100 µs the periods of this run go from 209.3 ms to 210.7 ms. Use initial conditions starts each voltage at 0 V. Without it, ngspice first calculates a steady state for the circuit and starts from there. Then the first charge does not start from an empty C, and the start of the plot does not match a power-up.
Figure 16-4 has the three numbers that Experiment 12 measured on the breadboard: the period and the two turning points. The table compares them with the calculation and with the NE555.
| Measurement | Calculated, Experiment 12 | Simulation | Breadboard, Experiment 12 | NE555, Experiment 1 |
|---|---|---|---|---|
| Period | About 208 ms | 209.3 ms | 192.59 ms | 200.46 ms |
| CAP minimum | About 1.67 V | 1.667 V | 1.56 V | 1.68 V |
| CAP maximum | About 3.33 V | 3.333 V | 3.12 V | 3.34 V |
| OUTPUT while C charges | High, Experiment 14 | High, 5.00 V | Low, the LED is on | High |
The simulation agrees with the calculation to 0.7 %. The charge takes 138.8 ms, and the calculation gives 138.6 ms. The discharge takes 70.5 ms, 1.2 ms more than the 69.3 ms of the calculation. During the discharge, Q20 holds DIS at 0.04 V. So C discharges towards 0.04 V, and it takes a little longer to reach 1/3 of the supply.
The turning points are at 1/3 and 2/3 of 5 V to 1 mV. In the simulation, the two transistors of each pair are identical, and each resistor has its exact value. Experiment 12 gave two possible causes for the lower turning points of the breadboard: the offsets of the comparators and the tolerances of the divider. The simulation has neither of them. The breadboard period is 8 % shorter than the simulation. Experiment 12 gave the causes of a difference of this size: the tolerances of RA, RB and C, the turning points and the measurement.
The run also tests four of the five changes of Experiment 14:
The fifth change of Experiment 14 is Q23 on S, for the reset. To test it, V2 holds RESET low for a time, as the RESET lead did in Experiment 13. A pulse source does this: it gives one voltage, then a second voltage for a set time, then the first voltage again.
Simulation_SPICE under V1, with the designator V2. Connect its + pin to a wire with the label RESET, and its − pin to a GND symbol.y1 = 5, y2 = 0, td = 350m, tr = 1u, tf = 1u, tw = 250m, per = 2. They are the start voltage, the pulse voltage, the delay, the times of the two changes, the width of the pulse and its period. V2 then gives 5 V, then 0 V from 350 ms to 600 ms, then 5 V again.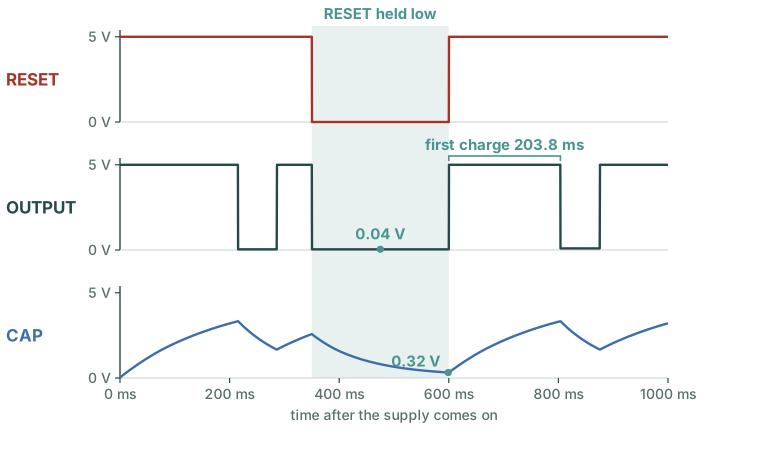
Figure 16-5 shows what the NE555 does during a reset: OUTPUT is low and C empties. The reset block holds Q at 0 through Q22 and S at 0 through Q23, so Q̄ stays at 1. When RESET goes high, C charges from 0.32 V in place of 1.67 V. So the first charge takes 203.8 ms in place of 138.8 ms. This is the long first charge of Experiment 13.
Figure 16-5 shows that the reset works with Q23. Experiment 14 gave the reason for Q23 on S: without it, OUTPUT goes high during a reset. The simulator can test that reason with one checkbox.
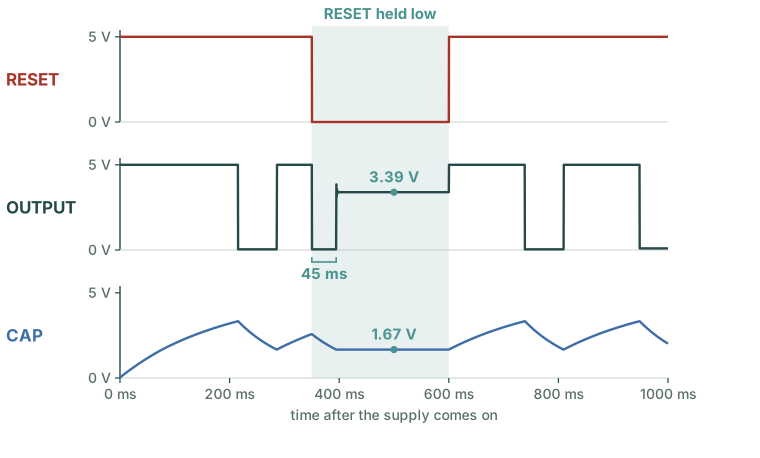
Figure 16-7 shows the reset circuit of the board at gate level, with Q23 pale. Follow the green numbers.
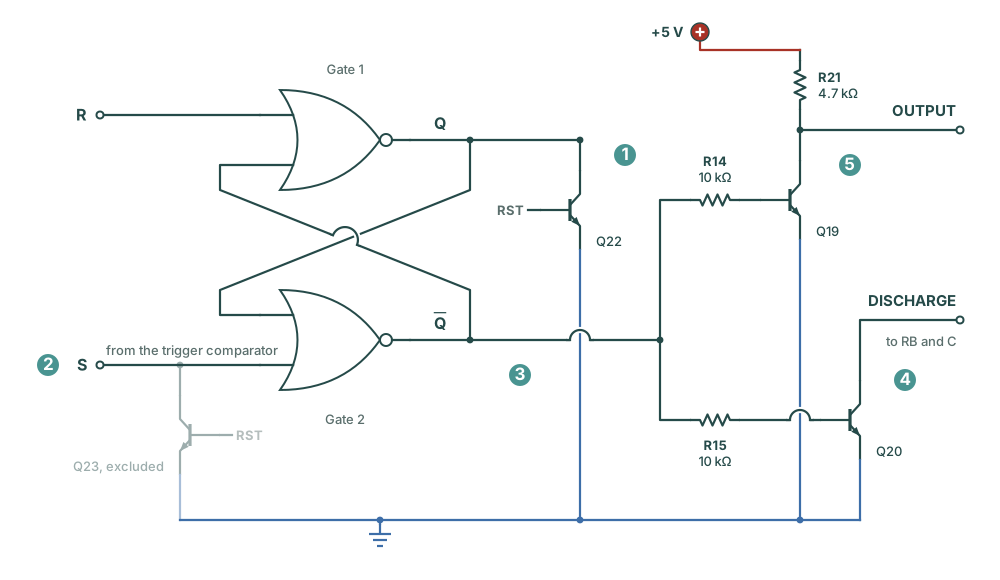
With Q23, S stays at 0 during the reset, so step 2 cannot change the latch. That is the reason for Q23 on S. Clear the checkbox Exclude from simulation on Q23 before you continue.
SPICE means Simulation Program with Integrated Circuit Emphasis. Laurence Nagel wrote it at the University of California, Berkeley, in the group of Donald Pederson, in the early 1970s. It was for the design of integrated circuits. ngspice is a free program that comes from Berkeley SPICE, and KiCad includes it.
Three questions on this experiment. They ask why the test bench is in a copy, why the discharge is longer than calculated, and what Q23 does.
1. Why does the test bench go in a copy of the project?
A wire on the schematic is a connection for the PCB Editor. The test bench needs THRESHOLD and TRIGGER joined, as on the breadboard. On the board they must stay two nets, so the test bench lives in 555-sim.
2. In the simulation the discharge takes 70.5 ms, and the calculation gives 69.3 ms. Why?
The calculation takes DIS at 0 V. Q20 in saturation holds it at 0.04 V. C discharges through RB towards that voltage, so it takes a little longer to fall from 2/3 to 1/3 of the supply.
3. Without Q23, RESET goes low. What does OUTPUT do?
When CAP falls to 1/3, the trigger comparator makes S 1, and S lowers Q̄. Q19 starts to turn off, so OUTPUT rises. Q23 holds S at 0 during a reset, so this cannot occur on the board.
The KiCad schematic runs as a timer in the simulator. Its period is 209.3 ms, 0.7 % from the calculation. CAP turns at 1/3 and 2/3 of the supply, OUTPUT is high while C charges, as on pin 3, and a reset holds OUTPUT low. Each of the five changes of Experiment 14 is in a run. That is the third step from the breadboard to the board. Keep 555-sim: if you change the master schematic, make the same change in the copy and run the simulation again. The parts still have no size or shape on the board. Experiment 17: Going Surface-Mount gives each part a footprint.